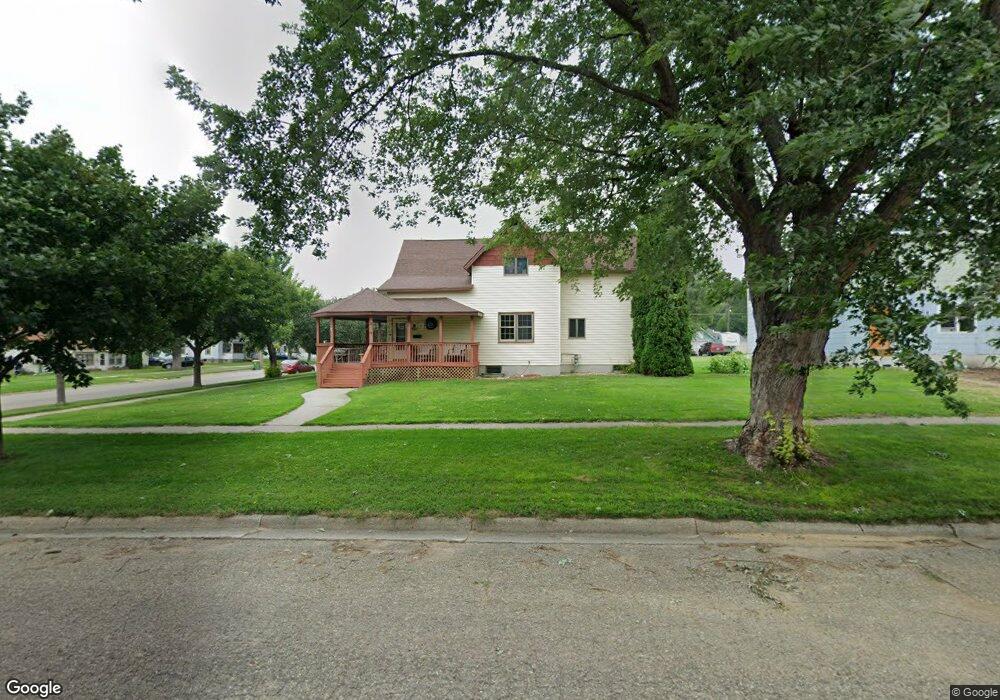
419 4th St SW Pipestone, MN 56164
Estimated Value: $191,234 - $249,000
4
Beds
3
Baths
2,298
Sq Ft
$94/Sq Ft
Est. Value
About This Home
This home is located at 419 4th St SW, Pipestone, MN 56164 and is currently estimated at $216,059, approximately $94 per square foot. 419 4th St SW is a home located in Pipestone County with nearby schools including Brown Elementary School, Pipestone Elementary School, and Pipestone Head Start.
Ownership History
Date
Name
Owned For
Owner Type
Purchase Details
Closed on
Jan 4, 2016
Sold by
Carlson Brook A and Carlson Clifford D
Bought by
Post Jesse
Current Estimated Value
Home Financials for this Owner
Home Financials are based on the most recent Mortgage that was taken out on this home.
Original Mortgage
$147,000
Interest Rate
4.01%
Purchase Details
Closed on
Dec 31, 2015
Sold by
Post Jesse and Post Melissa
Bought by
Ossefoort Eric and Ossefoort Danielle
Home Financials for this Owner
Home Financials are based on the most recent Mortgage that was taken out on this home.
Original Mortgage
$147,000
Interest Rate
4.01%
Purchase Details
Closed on
Jul 29, 2014
Sold by
Jpmorgan Chase Bank Na
Bought by
Post Jesse
Create a Home Valuation Report for This Property
The Home Valuation Report is an in-depth analysis detailing your home's value as well as a comparison with similar homes in the area
Home Values in the Area
Average Home Value in this Area
Purchase History
| Date | Buyer | Sale Price | Title Company |
|---|---|---|---|
| Post Jesse | -- | Attorney | |
| Ossefoort Eric | $147,500 | Attorney | |
| Ossefoort Eric Eric | $147,500 | -- | |
| Post Jesse | -- | Pipestone Abstract And Title |
Source: Public Records
Mortgage History
| Date | Status | Borrower | Loan Amount |
|---|---|---|---|
| Previous Owner | Ossefoort Eric Eric | $147,000 | |
| Previous Owner | Ossefoort Eric | $110,625 |
Source: Public Records
Tax History
| Year | Tax Paid | Tax Assessment Tax Assessment Total Assessment is a certain percentage of the fair market value that is determined by local assessors to be the total taxable value of land and additions on the property. | Land | Improvement |
|---|---|---|---|---|
| 2025 | $2,146 | $175,100 | $10,500 | $164,600 |
| 2024 | $2,146 | $170,400 | $10,500 | $159,900 |
| 2023 | $1,852 | $154,300 | $10,500 | $143,800 |
| 2022 | $1,652 | $128,900 | $7,500 | $121,400 |
| 2021 | $1,638 | $112,600 | $7,500 | $105,100 |
| 2020 | $1,448 | $110,300 | $7,500 | $102,800 |
| 2019 | $1,340 | $108,100 | $6,400 | $101,700 |
| 2018 | $1,338 | $102,400 | $6,400 | $96,000 |
| 2017 | $1,040 | $104,300 | $6,400 | $97,900 |
| 2016 | $1,316 | $0 | $0 | $0 |
| 2015 | $1,060 | $55,200 | $3,906 | $51,294 |
| 2014 | -- | $55,600 | $3,915 | $51,685 |
Source: Public Records
Map
Nearby Homes
Your Personal Tour Guide
Ask me questions while you tour the home.