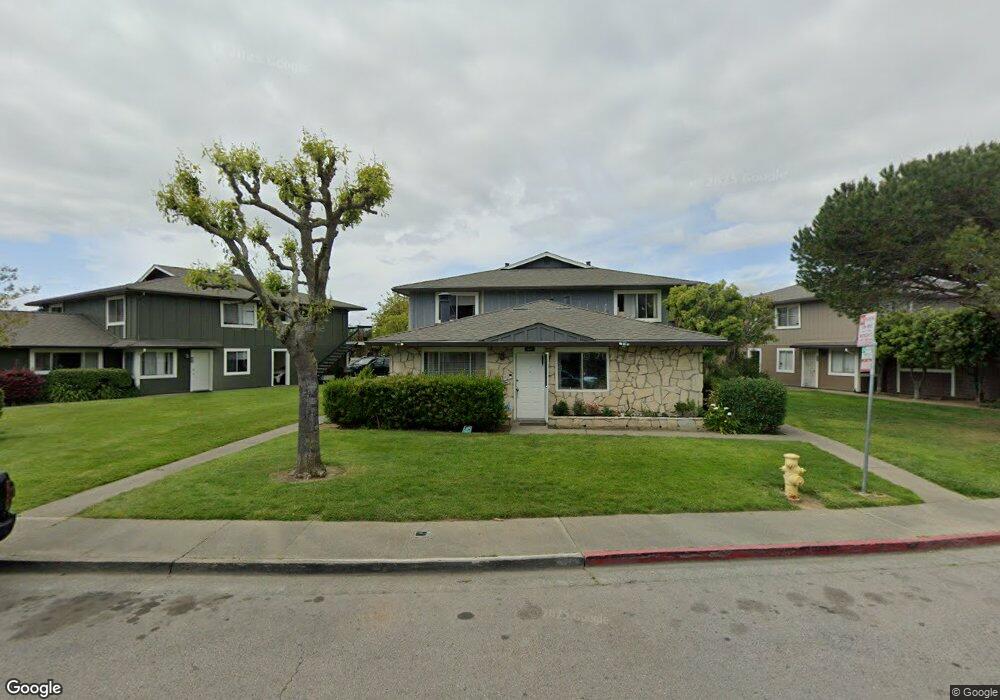
419 Bahia Way Unit 2 San Rafael, CA 94901
Canal NeighborhoodEstimated Value: $407,121 - $422,000
2
Beds
1
Bath
903
Sq Ft
$459/Sq Ft
Est. Value
About This Home
This home is located at 419 Bahia Way Unit 2, San Rafael, CA 94901 and is currently estimated at $414,707, approximately $459 per square foot. 419 Bahia Way Unit 2 is a home located in Marin County with nearby schools including Bahia Vista Elementary School, James B. Davidson Middle School, and San Rafael High School.
Ownership History
Date
Name
Owned For
Owner Type
Purchase Details
Closed on
Aug 1, 2016
Sold by
To Charles
Bought by
Hong Hai
Current Estimated Value
Home Financials for this Owner
Home Financials are based on the most recent Mortgage that was taken out on this home.
Original Mortgage
$120,000
Outstanding Balance
$95,746
Interest Rate
3.48%
Mortgage Type
Unknown
Estimated Equity
$318,961
Purchase Details
Closed on
Jun 20, 2014
Sold by
Tirman Arthur R and Tirman Arthur
Bought by
To Charles
Purchase Details
Closed on
May 10, 2002
Sold by
Gosliner Kenneth W and Gosliner Joan R
Bought by
Tirman Arthur R
Home Financials for this Owner
Home Financials are based on the most recent Mortgage that was taken out on this home.
Original Mortgage
$161,250
Interest Rate
7.13%
Create a Home Valuation Report for This Property
The Home Valuation Report is an in-depth analysis detailing your home's value as well as a comparison with similar homes in the area
Home Values in the Area
Average Home Value in this Area
Purchase History
| Date | Buyer | Sale Price | Title Company |
|---|---|---|---|
| Hong Hai | $240,000 | Old Republic Title Co | |
| Hong Hai Q | -- | Old Republic Title Co | |
| To Charles | $375,000 | Old Republic Title Company | |
| Tirman Arthur R | $215,000 | California Land Title Co |
Source: Public Records
Mortgage History
| Date | Status | Borrower | Loan Amount |
|---|---|---|---|
| Open | Hong Hai | $120,000 | |
| Previous Owner | Tirman Arthur R | $161,250 |
Source: Public Records
Tax History Compared to Growth
Tax History
| Year | Tax Paid | Tax Assessment Tax Assessment Total Assessment is a certain percentage of the fair market value that is determined by local assessors to be the total taxable value of land and additions on the property. | Land | Improvement |
|---|---|---|---|---|
| 2025 | $5,268 | $278,534 | $116,056 | $162,478 |
| 2024 | $5,268 | $273,074 | $113,781 | $159,293 |
| 2023 | $5,111 | $267,720 | $111,550 | $156,170 |
| 2022 | $4,885 | $262,471 | $109,363 | $153,108 |
| 2021 | $4,810 | $257,325 | $107,219 | $150,106 |
| 2020 | $4,721 | $254,688 | $106,120 | $148,568 |
| 2019 | $4,541 | $249,696 | $104,040 | $145,656 |
| 2018 | $4,491 | $244,800 | $102,000 | $142,800 |
| 2017 | $4,345 | $240,000 | $100,000 | $140,000 |
| 2016 | $3,561 | $181,217 | $82,842 | $98,375 |
| 2015 | $3,409 | $178,496 | $81,598 | $96,898 |
| 2014 | $3,049 | $157,248 | $69,888 | $87,360 |
Source: Public Records
Map
Nearby Homes
- 231 Playa Del Rey
- 80 Baypoint Dr
- 3665 Kerner Blvd Unit B
- 3665 Kerner Blvd Unit D
- 22 Fairfax St Unit B
- 110 Baypoint Dr Unit 2
- 139 Nantucket Cove
- 163 Bahia Cir
- 35 Fairfax St Unit 8
- 55 Dowitcher Way
- 124 Baypoint Dr
- 13 Hingham Cove
- 120 Canal St
- 199 Canal St Unit 6
- 20 Porto Bello Dr
- 48 Porto Bello Dr
- 29 Porto Bello Dr
- 9 Porto Bello Dr
- 21 Marina Blvd
- 56 Mooring Rd Unit 2
- 421 Bahia Way
- 423 Bahia Way Unit 4
- 427 Bahia Way
- 431 Bahia Way
- 413 Bahia Way
- 429 Bahia Way
- 425 Bahia Way
- 415 Bahia Way
- 409 Bahia Way
- 411 Bahia Way
- 307 Bahia Ln
- 439 Bahia Way Unit 4
- 303 Bahia Ln
- 437 Bahia Way
- 295 Playa Del Rey None
- 403 Bahia Way
- 295 Playa Del Rey Unkn
- 285 Playa Del Rey
- 305 Bahia Ln Unit 3