Estimated Value: $324,104 - $354,000
3
Beds
2
Baths
2,248
Sq Ft
$151/Sq Ft
Est. Value
About This Home
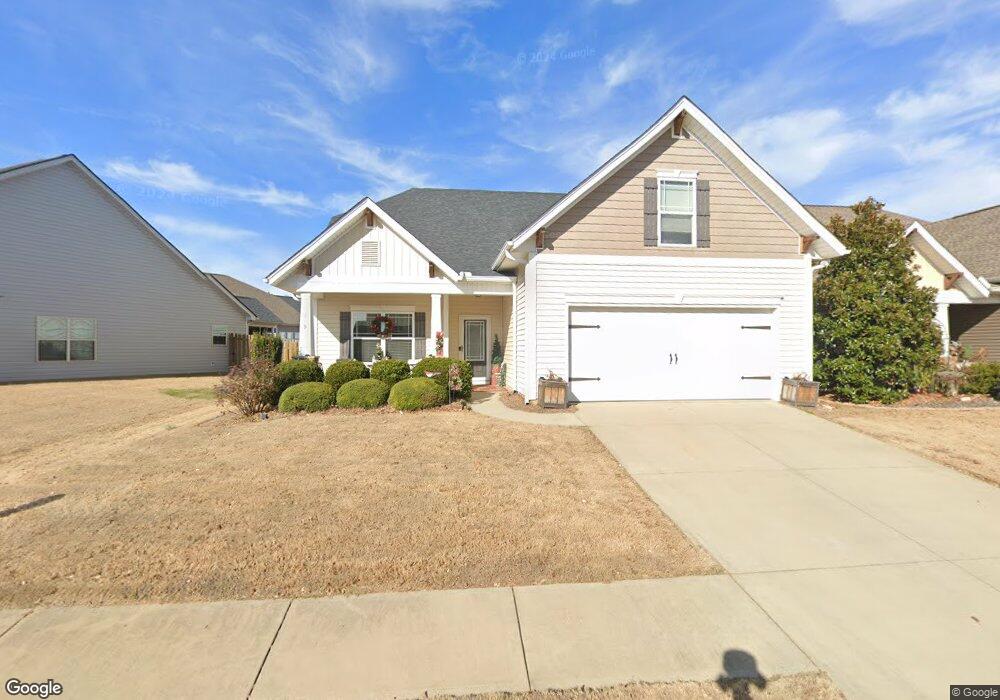
This home is located at 419 Listrac Dr, Moore, SC 29369 and is currently estimated at $338,526, approximately $150 per square foot. 419 Listrac Dr is a home located in Spartanburg County with nearby schools including Dorman High School Freshman Campus, Dorman High School, and Westgate Christian School.
Ownership History
Date
Name
Owned For
Owner Type
Purchase Details
Closed on
Jun 26, 2024
Sold by
Mundey Paul F
Bought by
Paul F Mundey Jr And Pamela A Mundey Joint Re and Mundey
Current Estimated Value
Purchase Details
Closed on
Dec 28, 2012
Sold by
Bk Residential Construction Llc
Bought by
Mundey Paul F and Mundey Pamela A
Home Financials for this Owner
Home Financials are based on the most recent Mortgage that was taken out on this home.
Original Mortgage
$87,000
Interest Rate
3.36%
Mortgage Type
Future Advance Clause Open End Mortgage
Purchase Details
Closed on
Jun 26, 2012
Sold by
Mark Iii Properties Inc
Bought by
Bk Residential Construction Llc
Purchase Details
Closed on
May 31, 2012
Sold by
Lazarus Shouse Communities Llc
Bought by
Mark Iii Properties Inc
Create a Home Valuation Report for This Property
The Home Valuation Report is an in-depth analysis detailing your home's value as well as a comparison with similar homes in the area
Home Values in the Area
Average Home Value in this Area
Purchase History
| Date | Buyer | Sale Price | Title Company |
|---|---|---|---|
| Paul F Mundey Jr And Pamela A Mundey Joint Re | -- | None Listed On Document | |
| Mundey Paul F | $166,900 | -- | |
| Bk Residential Construction Llc | $110,000 | -- | |
| Mark Iii Properties Inc | $100,000 | -- |
Source: Public Records
Mortgage History
| Date | Status | Borrower | Loan Amount |
|---|---|---|---|
| Previous Owner | Mundey Paul F | $87,000 |
Source: Public Records
Tax History
| Year | Tax Paid | Tax Assessment Tax Assessment Total Assessment is a certain percentage of the fair market value that is determined by local assessors to be the total taxable value of land and additions on the property. | Land | Improvement |
|---|---|---|---|---|
| 2022 | $1,116 | $7,618 | $800 | $6,818 |
| 2021 | $1,103 | $7,618 | $800 | $6,818 |
| 2020 | $1,439 | $7,618 | $800 | $6,818 |
| 2019 | $1,401 | $7,618 | $800 | $6,818 |
| 2018 | $1,407 | $7,618 | $800 | $6,818 |
| 2017 | $1,213 | $6,624 | $840 | $5,784 |
| 2016 | $1,241 | $6,624 | $840 | $5,784 |
| 2015 | $1,215 | $6,624 | $840 | $5,784 |
| 2014 | $1,177 | $6,624 | $840 | $5,784 |
Source: Public Records
Map
Nearby Homes
- 442 Listrac Dr
- 2141 Pomerol Dr
- 237 Medoc Ln
- 6002 Haddington Dr
- 32 Arbours West Ln
- 508 Sierra Ridge Ct
- 6086 Haddington Dr
- 708 Larado Ct
- 1149 Merlot Ct
- 422 Rambling Rose Way
- 123 Churchill Ave
- 919 Equine Dr
- 225 Georgetown Ct
- 2009 Hillman Way
- 2042 Hillman Way
- 2044 Hillman Way
- 2040 Hillman Way
- 214 Ashton Dr
- 214 Golden Pond Ct
- 2035 Hillman Way
Your Personal Tour Guide
Ask me questions while you tour the home.