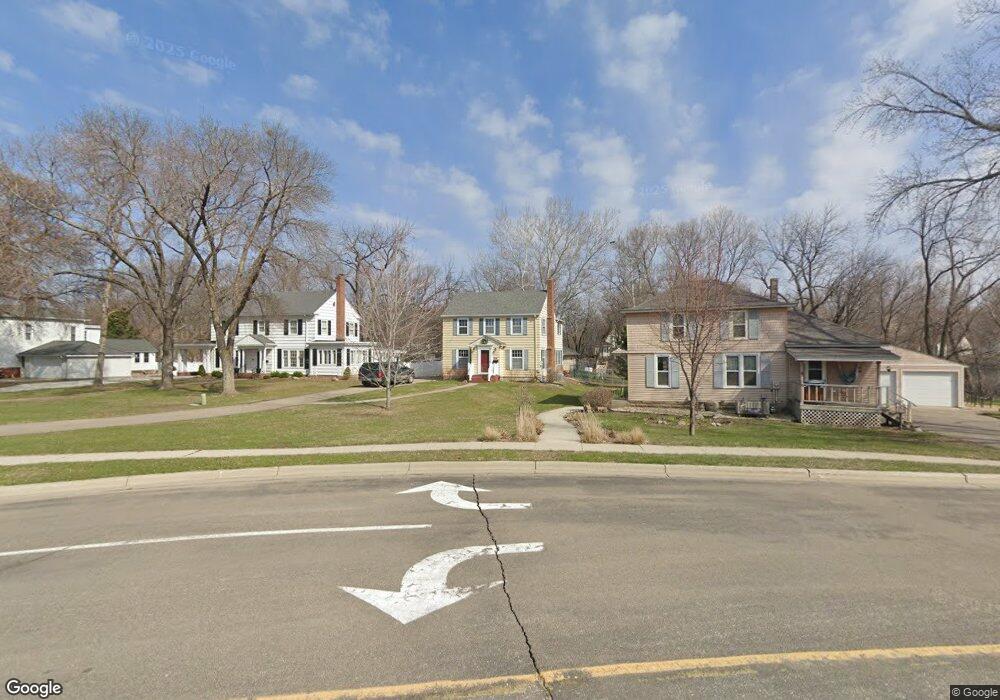
419 N 3rd St Marshall, MN 56258
Estimated Value: $215,985 - $290,000
About This Home
This home is located at 419 N 3rd St, Marshall, MN 56258 and is currently estimated at $245,246, approximately $111 per square foot. 419 N 3rd St is a home located in Lyon County with nearby schools including Park Side Elementary School, West Side Elementary School, and Marshall Middle School.
Ownership History
We collect this data history from publicly available records. To have your information removed, we recommend requesting removal directly through your county’s website.
Purchase Details
Home Financials for this Owner
Home Financials are based on the most recent Mortgage that was taken out on this home.Purchase Details
Home Financials for this Owner
Home Financials are based on the most recent Mortgage that was taken out on this home.Home Values in the Area
Average Home Value in this Area
Purchase History
We collect this data history from publicly available records. To have your information removed, we recommend requesting removal directly through your county’s website.
| Date | Buyer | Sale Price | Title Company |
|---|---|---|---|
| $179,000 | None Available | ||
| -- | -- |
Mortgage History
We collect this data history from publicly available records. To have your information removed, we recommend requesting removal directly through your county’s website.
| Date | Status | Borrower | Loan Amount |
|---|---|---|---|
| Open | $157,520 | ||
| Previous Owner | $150,750 |
Tax History
We collect this data history from publicly available records. To have your information removed, we recommend requesting removal directly through your county’s website.
| Year | Tax Paid | Tax Assessment Tax Assessment Total Assessment is a certain percentage of the fair market value that is determined by local assessors to be the total taxable value of land and additions on the property. | Land | Improvement |
|---|---|---|---|---|
| 2025 | $2,968 | $199,100 | $25,000 | $174,100 |
| 2024 | $2,686 | $244,900 | $25,000 | $219,900 |
| 2023 | $2,794 | $224,900 | $25,000 | $199,900 |
| 2022 | $2,458 | $221,100 | $25,000 | $196,100 |
| 2021 | $2,222 | $188,700 | $25,000 | $163,700 |
| 2020 | $2,156 | $171,300 | $25,000 | $146,300 |
| 2019 | $1,926 | $168,900 | $25,000 | $143,900 |
| 2018 | $1,758 | $152,200 | $16,400 | $135,800 |
| 2017 | $1,758 | $152,200 | $16,400 | $135,800 |
| 2016 | $1,662 | $0 | $0 | $0 |
| 2015 | -- | $0 | $0 | $0 |
| 2014 | -- | $0 | $0 | $0 |
Map
- 209 Walnut St
- 205 W Marshall St
- 420 N 5th St
- 206 S Whitney St
- 107 S Whitney St
- 222 N Whitney St
- 225 N Hill St
- 415 N 6th St
- 906 Birch St
- 907 Poplar Ave
- 700 W Main St
- 1011 Esther Cir
- 410 Lynd St
- 503 Darlene Dr
- 507 Darlene Dr
- 502 S Bruce St
- 514 Darlene Dr
- 500 Darlene Dr
- 1104 Esther Cir
- 503 Washington Ave
Ask me questions while you tour the home.