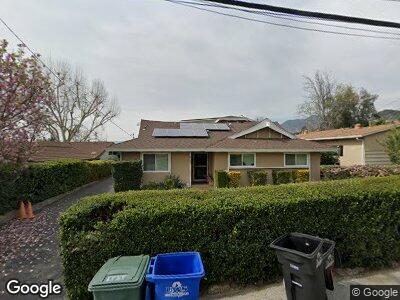
4191 Canyon Crest Rd Altadena, CA 91001
Estimated Value: $1,384,000 - $1,734,626
4
Beds
3
Baths
1,909
Sq Ft
$795/Sq Ft
Est. Value
About This Home
This home is located at 4191 Canyon Crest Rd, Altadena, CA 91001 and is currently estimated at $1,517,907, approximately $795 per square foot. 4191 Canyon Crest Rd is a home located in Los Angeles County with nearby schools including Charles W. Eliot Arts Magnet Academy, John Muir High School, and Odyssey Charter School.
Ownership History
Date
Name
Owned For
Owner Type
Purchase Details
Closed on
Jun 8, 2007
Sold by
Martel Ann Niederer
Bought by
Drouin Brian and Jaramillo Veronica
Current Estimated Value
Home Financials for this Owner
Home Financials are based on the most recent Mortgage that was taken out on this home.
Original Mortgage
$525,000
Interest Rate
6.66%
Mortgage Type
New Conventional
Purchase Details
Closed on
Feb 12, 2001
Sold by
Washington Mutual Bank Fa
Bought by
Martel Ann Niederer and Bracken John Phillip
Home Financials for this Owner
Home Financials are based on the most recent Mortgage that was taken out on this home.
Original Mortgage
$265,500
Interest Rate
6.98%
Purchase Details
Closed on
Sep 28, 2000
Sold by
Blaylock Reginald E
Bought by
Washington Mutual Bank Fa
Create a Home Valuation Report for This Property
The Home Valuation Report is an in-depth analysis detailing your home's value as well as a comparison with similar homes in the area
Home Values in the Area
Average Home Value in this Area
Purchase History
| Date | Buyer | Sale Price | Title Company |
|---|---|---|---|
| Drouin Brian | $757,000 | First Southwestern Title Co | |
| Martel Ann Niederer | $295,000 | Fidelity National Title Co | |
| Washington Mutual Bank Fa | $260,000 | Benefit Land Title Ins Co |
Source: Public Records
Mortgage History
| Date | Status | Borrower | Loan Amount |
|---|---|---|---|
| Open | Drouin Brian | $560,000 | |
| Closed | Drouin Brian | $182,700 | |
| Closed | Drouin Brian | $492,500 | |
| Closed | Drouin Brian | $518,600 | |
| Previous Owner | Drouin Brian | $525,000 | |
| Previous Owner | Martel Ann Niederer | $263,650 | |
| Previous Owner | Martel Ann Niederer | $265,500 |
Source: Public Records
Tax History Compared to Growth
Tax History
| Year | Tax Paid | Tax Assessment Tax Assessment Total Assessment is a certain percentage of the fair market value that is determined by local assessors to be the total taxable value of land and additions on the property. | Land | Improvement |
|---|---|---|---|---|
| 2024 | $13,065 | $1,114,596 | $688,173 | $426,423 |
| 2023 | $12,903 | $1,092,742 | $674,680 | $418,062 |
| 2022 | $12,408 | $1,071,316 | $661,451 | $409,865 |
| 2021 | $11,783 | $1,050,311 | $648,482 | $401,829 |
| 2019 | $11,338 | $1,019,160 | $629,249 | $389,911 |
| 2018 | $10,745 | $930,300 | $569,000 | $361,300 |
| 2016 | $9,391 | $805,000 | $569,000 | $236,000 |
| 2015 | $8,256 | $701,000 | $495,600 | $205,400 |
| 2014 | $8,237 | $701,000 | $495,600 | $205,400 |
Source: Public Records
Map
Nearby Homes
- 4156 Aralia Rd
- 3731 N Hollingsworth Rd
- 3435 Crestford Dr
- 3736 N Hollingsworth Rd
- 3873 Lilac Canyon Ln
- 605 Coate Ct
- 608 Chaparral Ct
- 3710 Sunset Ridge Rd
- 560 W Loma Alta Dr
- 603 Villa Zanita St
- 5140 Crown Ave
- 510 Starlight Crest Dr
- 408 W Poppyfields Dr
- 509 W Altadena Dr
- 3079 Thurin Ave
- 401 W Palm St
- 2994 Bargen Way
- 305 W Las Flores Dr
- 622 W Mariposa St
- 785 W Harriet St
- 4191 Canyon Crest Rd
- 4199 Canyon Crest Rd
- 4175 Canyon Crest Rd
- 4209 Canyon Crest Rd
- 4188 Aralia Rd
- 4171 Canyon Crest Rd
- 4200 Aralia Rd
- 4176 Aralia Rd
- 4210 Aralia Rd
- 4166 Aralia Rd
- 4219 Canyon Crest Rd
- 4159 Canyon Crest Rd
- 4216 Aralia Rd
- 4229 Canyon Crest Rd
- 4170 Canyon Crest Rd
- 4184 Canyon Crest Rd
- 4151 Canyon Crest Rd
- 4160 Canyon Crest Rd
- 4224 Aralia Rd
- 4146 Aralia Rd