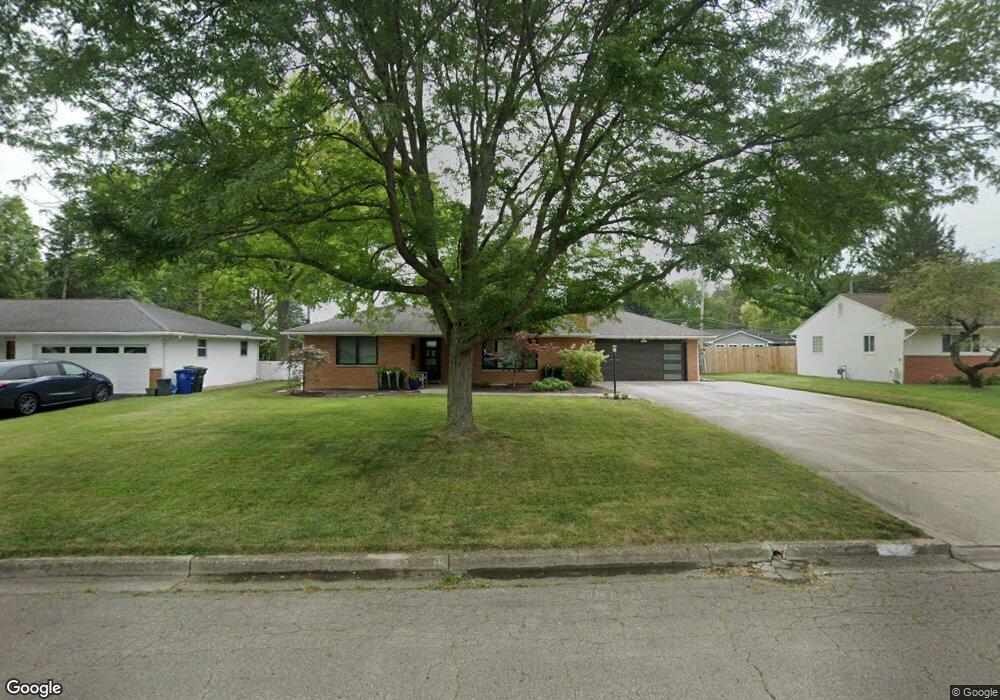
4194 Fairoaks Dr Columbus, OH 43214
Clintonville NeighborhoodEstimated Value: $477,000 - $526,000
3
Beds
2
Baths
1,830
Sq Ft
$270/Sq Ft
Est. Value
About This Home
This home is located at 4194 Fairoaks Dr, Columbus, OH 43214 and is currently estimated at $494,987, approximately $270 per square foot. 4194 Fairoaks Dr is a home located in Franklin County with nearby schools including Colerain Elementary School, Dominion Middle School, and Whetstone High School.
Ownership History
Date
Name
Owned For
Owner Type
Purchase Details
Closed on
Jul 31, 2020
Sold by
North Jennifer N and North Jennifer E
Bought by
North Catherine
Current Estimated Value
Purchase Details
Closed on
Sep 4, 2013
Sold by
North Catherine L
Bought by
North Christopher M and North Jennifer N
Home Financials for this Owner
Home Financials are based on the most recent Mortgage that was taken out on this home.
Original Mortgage
$114,000
Interest Rate
3.25%
Mortgage Type
Adjustable Rate Mortgage/ARM
Purchase Details
Closed on
May 19, 2009
Sold by
North Catherine L and Imogene Crowder Living Trust
Bought by
North Catherine L
Purchase Details
Closed on
Aug 20, 2003
Sold by
Crowder Imogene
Bought by
Crowder Imogene and The Imogene Crowder Living Tru
Purchase Details
Closed on
Aug 19, 1987
Bought by
Crowder Arthur L
Create a Home Valuation Report for This Property
The Home Valuation Report is an in-depth analysis detailing your home's value as well as a comparison with similar homes in the area
Home Values in the Area
Average Home Value in this Area
Purchase History
| Date | Buyer | Sale Price | Title Company |
|---|---|---|---|
| North Catherine | $340,000 | Crown Search Services | |
| North Christopher M | $210,000 | Chicago Title Box | |
| North Catherine L | -- | Attorney | |
| Crowder Imogene | -- | -- | |
| Crowder Arthur L | $83,900 | -- |
Source: Public Records
Mortgage History
| Date | Status | Borrower | Loan Amount |
|---|---|---|---|
| Previous Owner | North Christopher M | $114,000 |
Source: Public Records
Tax History Compared to Growth
Tax History
| Year | Tax Paid | Tax Assessment Tax Assessment Total Assessment is a certain percentage of the fair market value that is determined by local assessors to be the total taxable value of land and additions on the property. | Land | Improvement |
|---|---|---|---|---|
| 2024 | $6,659 | $142,040 | $50,790 | $91,250 |
| 2023 | $6,578 | $142,030 | $50,785 | $91,245 |
| 2022 | $6,885 | $126,740 | $56,390 | $70,350 |
| 2021 | $6,897 | $126,740 | $56,390 | $70,350 |
| 2020 | $6,594 | $126,740 | $56,390 | $70,350 |
| 2019 | $5,797 | $95,560 | $43,370 | $52,190 |
| 2018 | $5,260 | $95,560 | $43,370 | $52,190 |
| 2017 | $5,793 | $95,560 | $43,370 | $52,190 |
| 2016 | $5,217 | $78,750 | $26,180 | $52,570 |
| 2015 | $4,736 | $78,750 | $26,180 | $52,570 |
| 2014 | $4,747 | $78,750 | $26,180 | $52,570 |
| 2013 | $2,293 | $74,970 | $24,920 | $50,050 |
Source: Public Records
Map
Nearby Homes
- 4193 Eastlea Dr
- 4266 Fairoaks Dr
- 4299 Colerain Ave
- 685 Yaronia Dr N
- 4000 Indianola Ave
- 340 Canyon Dr S
- 814 Meadowview Dr
- 411 Garden Rd
- 541 Northridge Rd
- 197 E Cooke Rd
- 374 Acton Rd
- 4508 Glenmawr Ave
- 3938 Eisenhower Rd
- 522 E Beechwold Blvd
- 958 Janet Dr
- 128 Blenheim Rd
- 540 Fallis Rd
- 995 Overbrook Service Dr
- 518 E Royal Forest Blvd
- 1064 Hillsdale Dr
- 4206 Fairoaks Dr
- 4184 Fairoaks Dr
- 4187 Lawnview Dr
- 4197 Lawnview Dr
- 4218 Fairoaks Dr
- 4175 Lawnview Dr
- 4197 Fairoaks Dr
- 4209 Lawnview Dr
- 4187 Fairoaks Dr
- 602 E Cooke Rd
- 4211 Fairoaks Dr
- 614 E Cooke Rd
- 584 E Cooke Rd
- 4219 Lawnview Dr
- 4228 Fairoaks Dr
- 628 E Cooke Rd
- 4225 Fairoaks Dr
- 572 E Cooke Rd
- 4194 Colerain Ave
- 4194 Lawnview Dr