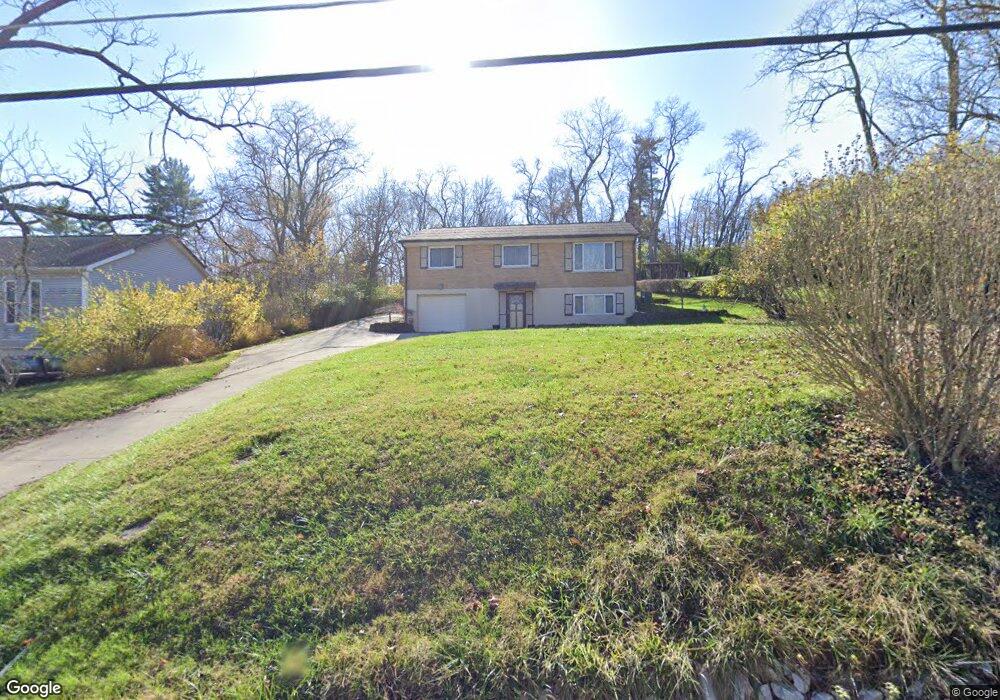
4195 Hubble Rd Cincinnati, OH 45247
White Oak West NeighborhoodEstimated Value: $249,000 - $308,000
3
Beds
2
Baths
1,455
Sq Ft
$188/Sq Ft
Est. Value
About This Home
This home is located at 4195 Hubble Rd, Cincinnati, OH 45247 and is currently estimated at $272,865, approximately $187 per square foot. 4195 Hubble Rd is a home located in Hamilton County with nearby schools including Monfort Heights Elementary School, White Oak Middle School, and Colerain High School.
Create a Home Valuation Report for This Property
The Home Valuation Report is an in-depth analysis detailing your home's value as well as a comparison with similar homes in the area
Home Values in the Area
Average Home Value in this Area
Tax History Compared to Growth
Tax History
| Year | Tax Paid | Tax Assessment Tax Assessment Total Assessment is a certain percentage of the fair market value that is determined by local assessors to be the total taxable value of land and additions on the property. | Land | Improvement |
|---|---|---|---|---|
| 2024 | $3,580 | $67,428 | $13,930 | $53,498 |
| 2023 | $3,597 | $67,428 | $13,930 | $53,498 |
| 2022 | $3,166 | $48,455 | $13,003 | $35,452 |
| 2021 | $2,902 | $48,455 | $13,003 | $35,452 |
| 2020 | $2,931 | $48,455 | $13,003 | $35,452 |
| 2019 | $2,889 | $43,264 | $11,610 | $31,654 |
| 2018 | $2,574 | $43,264 | $11,610 | $31,654 |
| 2017 | $2,432 | $43,264 | $11,610 | $31,654 |
| 2016 | $2,511 | $44,002 | $11,494 | $32,508 |
| 2015 | $2,534 | $44,002 | $11,494 | $32,508 |
| 2014 | $2,539 | $44,002 | $11,494 | $32,508 |
| 2013 | $2,399 | $44,447 | $11,610 | $32,837 |
Source: Public Records
Map
Nearby Homes
- 6364 Oakcreek Dr
- 7030 King James Ct
- 4538 Philnoll Dr
- 5160 Jessup Rd
- 4593 Farview Ln
- 6705 Cheviot Rd Unit 3
- 4600 Farcrest Ct
- 3927 Philnoll Dr
- 5979 Fawnridge Ct
- 5765 Cheviot Rd Unit 52D
- 5765 Cheviot Rd
- 6195 Seiler Dr
- 5759 Cheviot Rd
- 3547 Jessup Rd
- 6321 Duet Ln
- 3387 Lapland Dr
- 3398 Stevie Ln
- 7620 Cheviot Rd
- 6893 Newbridge Dr
- 3701 W Galbraith Rd
- 4189 Hubble Rd
- 4257 Hubble Rd
- 4169 Hubble Rd
- 4289 Hubble Rd
- 6138 Ramblingridge Dr
- 4290 Hubble Rd
- 6132 Ramblingridge Dr
- 6154 Ramblingridge Dr
- 4200 Hubble Rd
- 4321 Hubble Rd
- 6128 Ramblingridge Dr
- 4049 Hubble Rd
- 4308 Hubble Rd
- 6120 Ramblingridge Dr
- 6166 Ramblingridge Dr
- 4330 Hubble Rd
- 4023 Hubble Rd
- 4170 Hubble Rd
- 6112 Ramblingridge Dr
- 4357 Hubble Rd