
42 Aubin St Seekonk, MA 02771
Monroes-South Seekonk Neighborhood
0.84
Acre
$210,714
Price per Acre
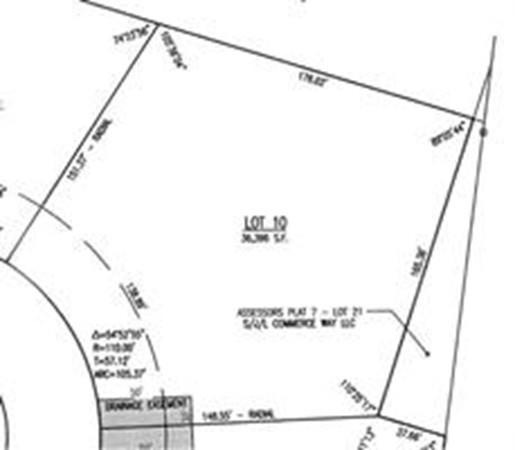
36,590
Sq Ft Lot
Highlights
- Property is near public transit
- Shops
- Level Lot
About This Lot
As of August 2023The last remaining lot at Rolling Meadows. At over 3/4 of an acre and tucked on the corner of the street with natural gas and town water, this lot is a great find for anyone looking to build in Seekonk. We can also provide complete pricing to build your home.
Last Agent to Sell the Property
Gina Vicente
HomeSmart Professionals Real Estate Listed on: 10/14/2015
Property Details
Property Type
- Land
Est. Annual Taxes
- $2,227
Lot Details
- 0.84 Acre Lot
- Level Lot
Location
- Property is near public transit
- Property is near schools
Utilities
- Perc Test On File For Septic Tank
- Private Sewer
Listing and Financial Details
- Tax Lot 370
- Assessor Parcel Number 4722008
Community Details
Amenities
- Shops
Recreation
- Electricity Available at Street
Ownership History
Date
Name
Owned For
Owner Type
Purchase Details
Closed on
Jul 6, 2010
Sold by
North Liberty Llc
Bought by
Anthony Street Dev Llc
Purchase Details
Closed on
Aug 21, 2008
Sold by
Anthony Street Dev Llc
Bought by
North Liberty Llc
Similar Property in Seekonk, MA
Create a Home Valuation Report for This Property
The Home Valuation Report is an in-depth analysis detailing your home's value as well as a comparison with similar homes in the area
Home Values in the Area
Average Home Value in this Area
Purchase History
| Date | Type | Sale Price | Title Company |
|---|---|---|---|
| Deed | $209,000 | -- | |
| Deed | $209,000 | -- |
Source: Public Records
Mortgage History
| Date | Status | Loan Amount | Loan Type |
|---|---|---|---|
| Open | $218,000 | Second Mortgage Made To Cover Down Payment | |
| Closed | $175,000 | New Conventional |
Source: Public Records
Property History
| Date | Event | Price | Change | Sq Ft Price |
|---|---|---|---|---|
| 06/19/2025 06/19/25 | For Sale | $939,000 | +7.0% | $445 / Sq Ft |
| 08/15/2023 08/15/23 | Sold | $877,500 | -2.3% | $415 / Sq Ft |
| 06/24/2023 06/24/23 | Pending | -- | -- | -- |
| 06/03/2023 06/03/23 | For Sale | $897,900 | +404.4% | $425 / Sq Ft |
| 04/25/2017 04/25/17 | Sold | $178,000 | +0.6% | $51 / Sq Ft |
| 03/26/2017 03/26/17 | Pending | -- | -- | -- |
| 12/30/2016 12/30/16 | Sold | $177,000 | -6.8% | $51 / Sq Ft |
| 11/30/2016 11/30/16 | Pending | -- | -- | -- |
| 10/14/2015 10/14/15 | For Sale | $189,900 | 0.0% | $54 / Sq Ft |
| 10/03/2014 10/03/14 | For Sale | $189,900 | +8.5% | $54 / Sq Ft |
| 06/21/2012 06/21/12 | Sold | $175,000 | -5.4% | $50 / Sq Ft |
| 05/24/2012 05/24/12 | Pending | -- | -- | -- |
| 02/09/2007 02/09/07 | For Sale | $185,000 | -- | $53 / Sq Ft |
Source: MLS Property Information Network (MLS PIN)
Tax History Compared to Growth
Tax History
| Year | Tax Paid | Tax Assessment Tax Assessment Total Assessment is a certain percentage of the fair market value that is determined by local assessors to be the total taxable value of land and additions on the property. | Land | Improvement |
|---|---|---|---|---|
| 2025 | $11,469 | $928,700 | $244,000 | $684,700 |
| 2024 | $9,774 | $791,400 | $221,800 | $569,600 |
| 2023 | $9,439 | $720,000 | $201,400 | $518,600 |
| 2022 | $8,520 | $638,700 | $195,300 | $443,400 |
| 2021 | $8,246 | $607,700 | $177,400 | $430,300 |
| 2020 | $7,683 | $583,400 | $176,900 | $406,500 |
| 2019 | $7,405 | $567,000 | $176,900 | $390,100 |
| 2018 | $2,276 | $170,500 | $170,500 | $0 |
| 2017 | $2,295 | $170,500 | $170,500 | $0 |
| 2016 | $2,286 | $170,500 | $170,500 | $0 |
| 2015 | $2,211 | $167,100 | $167,100 | $0 |
Source: Public Records
Agents Affiliated with this Home
-
Isabelle Gonsalves
I
Seller's Agent in 2023
Isabelle Gonsalves
Lamacchia Realty, Inc
(401) 527-7740
2 in this area
17 Total Sales
-
Thomas Little
T
Buyer's Agent in 2023
Thomas Little
Gustave White Sotheby's Realty
1 in this area
24 Total Sales
-
G
Seller's Agent in 2017
Gina Vicente
HomeSmart Professionals
(401) 465-7111
-
Laura Fortin
Buyer's Agent in 2017
Laura Fortin
Heritage Realty Group, LLC
(508) 801-1909
57 Total Sales
-
Diane Aubin
Seller's Agent in 2012
Diane Aubin
Aubin Realty
(401) 524-5877
1 in this area
29 Total Sales
Map
Source: MLS Property Information Network (MLS PIN)
MLS Number: 71918766
APN: SEEK-000070-000000-003700
Disclaimer: Certain information contained herein is derived from information provided by parties other than Homes.com. All information provided is deemed reliable, but is not guaranteed to be accurate and should be independently verified.
![]() The property listing data and information, or the Images, set forth herein were provided to MLS Property Information Network, Inc. from third party sources, including sellers, lessors and public records, and were compiled by MLS Property Information Network, Inc. The property listing data and information, and the Images, are for the personal, non-commercial use of consumers having a good faith interest in purchasing or leasing listed properties of the type displayed to them and may not be used for any purpose other than to identify prospective properties which such consumers may have a good faith interest in purchasing or leasing. MLS Property Information Network, Inc. and its subscribers disclaim any and all representations and warranties as to the accuracy of the property listing data and information, or as to the accuracy of any of the Images, set forth herein.
The property listing data and information, or the Images, set forth herein were provided to MLS Property Information Network, Inc. from third party sources, including sellers, lessors and public records, and were compiled by MLS Property Information Network, Inc. The property listing data and information, and the Images, are for the personal, non-commercial use of consumers having a good faith interest in purchasing or leasing listed properties of the type displayed to them and may not be used for any purpose other than to identify prospective properties which such consumers may have a good faith interest in purchasing or leasing. MLS Property Information Network, Inc. and its subscribers disclaim any and all representations and warranties as to the accuracy of the property listing data and information, or as to the accuracy of any of the Images, set forth herein.
Nearby Homes
- 25 Watson St
- 199 Cole St
- 38 Apple Orchard Ln
- 17 Marehaven Dr
- 1550 Fall River Ave
- 182 Ferncliffe Rd
- 454 Fall River Ave
- 0 Olney St
- 5 Colfall St
- 14 Airdrie Ct
- 1 Winter Dr
- 51 Marnoch Dr
- 759 Fall River Ave
- 133 Jean Dr
- 23 George St
- 25 Pimental Dr
- 42 Tee Jay Dr
- 272 County St
- 75 County St
- 75 County St Unit 6