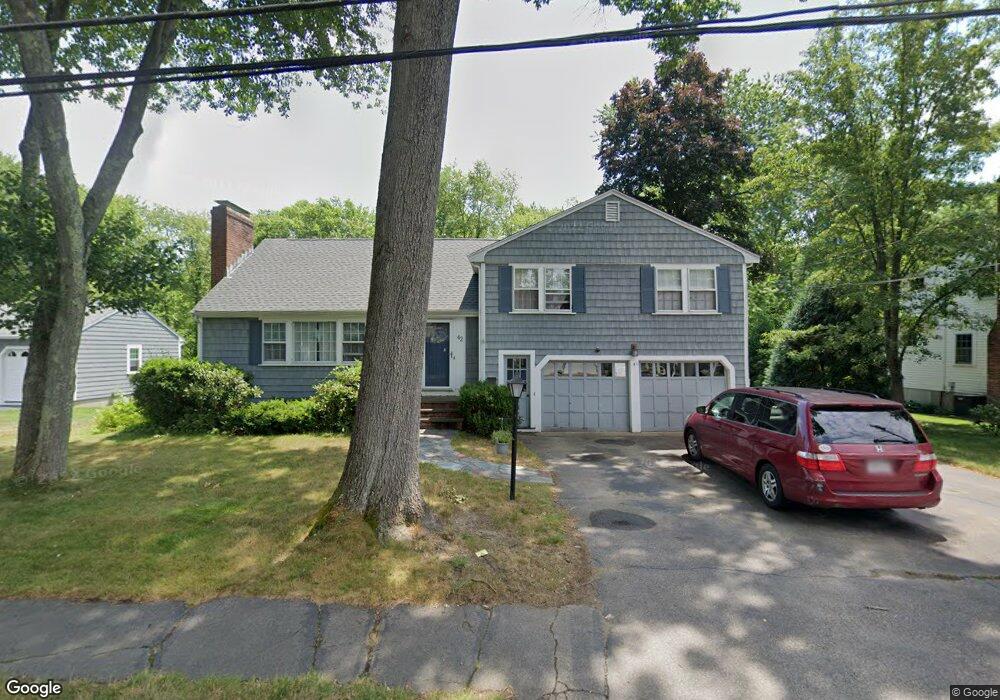
42 Blacksmith Dr Needham, MA 02492
Estimated Value: $1,237,000 - $1,895,000
4
Beds
3
Baths
3,200
Sq Ft
$479/Sq Ft
Est. Value
About This Home
This home is located at 42 Blacksmith Dr, Needham, MA 02492 and is currently estimated at $1,533,536, approximately $479 per square foot. 42 Blacksmith Dr is a home located in Norfolk County with nearby schools including High Rock Middle School, Sunita L. Williams Elementary School, and Pollard Middle School.
Ownership History
Date
Name
Owned For
Owner Type
Purchase Details
Closed on
Nov 17, 2006
Sold by
Mulcahy James F and Warner Margaret M
Bought by
Lee Christopher and Lee Elizabeth
Current Estimated Value
Home Financials for this Owner
Home Financials are based on the most recent Mortgage that was taken out on this home.
Original Mortgage
$417,000
Interest Rate
6.33%
Mortgage Type
Purchase Money Mortgage
Create a Home Valuation Report for This Property
The Home Valuation Report is an in-depth analysis detailing your home's value as well as a comparison with similar homes in the area
Home Values in the Area
Average Home Value in this Area
Purchase History
| Date | Buyer | Sale Price | Title Company |
|---|---|---|---|
| Lee Christopher | $676,500 | -- | |
| Lee Christopher | $676,500 | -- |
Source: Public Records
Mortgage History
| Date | Status | Borrower | Loan Amount |
|---|---|---|---|
| Open | Lee Christopher | $393,500 | |
| Closed | Lee Christopher | $398,000 | |
| Closed | Lee Christopher | $417,000 |
Source: Public Records
Tax History
| Year | Tax Paid | Tax Assessment Tax Assessment Total Assessment is a certain percentage of the fair market value that is determined by local assessors to be the total taxable value of land and additions on the property. | Land | Improvement |
|---|---|---|---|---|
| 2025 | $11,242 | $1,060,600 | $741,700 | $318,900 |
| 2024 | $9,862 | $787,700 | $519,200 | $268,500 |
| 2023 | $9,968 | $764,400 | $519,200 | $245,200 |
| 2022 | $9,568 | $715,600 | $477,600 | $238,000 |
| 2021 | $9,324 | $715,600 | $477,600 | $238,000 |
| 2020 | $9,331 | $747,100 | $477,600 | $269,500 |
| 2019 | $8,701 | $702,300 | $435,500 | $266,800 |
| 2018 | $8,343 | $702,300 | $435,500 | $266,800 |
| 2017 | $7,945 | $668,200 | $435,500 | $232,700 |
| 2016 | $7,711 | $668,200 | $435,500 | $232,700 |
| 2015 | $7,544 | $668,200 | $435,500 | $232,700 |
| 2014 | $7,698 | $661,300 | $380,600 | $280,700 |
Source: Public Records
Map
Nearby Homes
- 52 Hancock Rd
- 3 Hancock Rd
- 193 Garden St
- 19 Highland Ct Unit 19
- 102 Jarvis Cir Unit 102
- 19 Oakland Ave Unit 19
- 73 Maple St Unit 1
- 81 Parish Rd
- 100 Rosemary Way Unit 129
- 34 Pershing Rd
- 36 Eliot Rd
- 620 High Rock St
- 447 Hillside Ave
- 58 Morton St
- 385 Hillside Ave
- 385 Hillside Ave Unit 385
- 3 Crescent Rd
- 233 Warren St
- 638 Webster St
- 638 Webster St Unit 638
- 50 Blacksmith Dr
- 34 Blacksmith Dr
- 27 Newell Ave
- 31 Newell Ave
- 21 Newell Ave
- 56 Blacksmith Dr
- 28 Blacksmith Dr
- 37 Newell Ave
- 17 Newell Ave
- 49 Blacksmith Dr
- 39 Blacksmith Dr
- 43 Newell Ave
- 33 Blacksmith Dr
- 55 Blacksmith Dr
- 64 Blacksmith Dr
- 11 Newell Ave
- 49 Newell Ave
- 25 Blacksmith Dr
- 14 Blacksmith Dr
- 34 Newell Ave
Your Personal Tour Guide
Ask me questions while you tour the home.