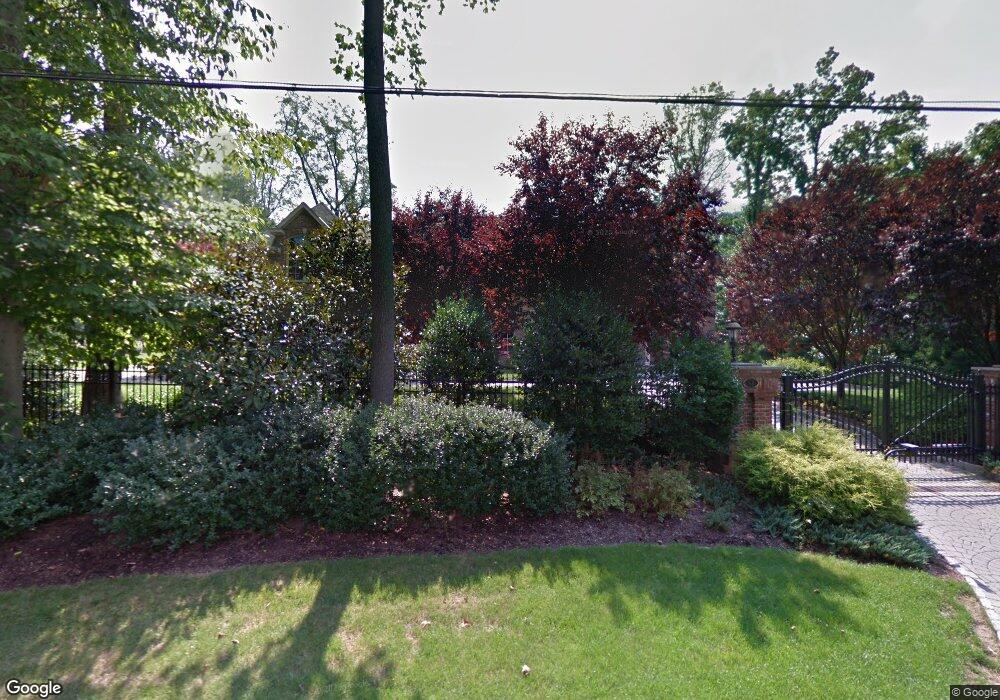
42 Brenner Place Demarest, NJ 07627
Estimated Value: $4,337,891 - $5,340,000
Studio
--
Bath
7,078
Sq Ft
$694/Sq Ft
Est. Value
About This Home
This home is located at 42 Brenner Place, Demarest, NJ 07627 and is currently estimated at $4,914,297, approximately $694 per square foot. 42 Brenner Place is a home located in Bergen County with nearby schools including County Road Elementary School, Demarest Middle School, and Luther Lee Emerson Elementary School.
Ownership History
Date
Name
Owned For
Owner Type
Purchase Details
Closed on
Dec 11, 2009
Sold by
Sheffield Gary and Sheffield Deleon
Bought by
Davis Scott R and Davis Elizabeth Q
Current Estimated Value
Home Financials for this Owner
Home Financials are based on the most recent Mortgage that was taken out on this home.
Original Mortgage
$2,957,500
Interest Rate
4.92%
Mortgage Type
Unknown
Purchase Details
Closed on
Dec 13, 2002
Sold by
Alliotts Kathleen
Bought by
Alliotts Kathleen and Alliotts Frank
Home Financials for this Owner
Home Financials are based on the most recent Mortgage that was taken out on this home.
Original Mortgage
$630,700
Interest Rate
6.02%
Purchase Details
Closed on
Jun 28, 2001
Sold by
Estate Of Alfred J Riecker
Bought by
Alliotts Kevin
Home Financials for this Owner
Home Financials are based on the most recent Mortgage that was taken out on this home.
Original Mortgage
$637,500
Interest Rate
6.85%
Create a Home Valuation Report for This Property
The Home Valuation Report is an in-depth analysis detailing your home's value as well as a comparison with similar homes in the area
Home Values in the Area
Average Home Value in this Area
Purchase History
| Date | Buyer | Sale Price | Title Company |
|---|---|---|---|
| Davis Scott R | $4,350,000 | -- | |
| Alliotts Kathleen | -- | -- | |
| Alliotts Kevin | $850,000 | -- |
Source: Public Records
Mortgage History
| Date | Status | Borrower | Loan Amount |
|---|---|---|---|
| Previous Owner | Davis Scott R | $2,957,500 | |
| Previous Owner | Alliotts Kathleen | $630,700 | |
| Previous Owner | Alliotts Kevin | $637,500 |
Source: Public Records
Tax History
| Year | Tax Paid | Tax Assessment Tax Assessment Total Assessment is a certain percentage of the fair market value that is determined by local assessors to be the total taxable value of land and additions on the property. | Land | Improvement |
|---|---|---|---|---|
| 2025 | $26,538 | $3,244,200 | $1,150,000 | $2,094,200 |
| 2024 | $25,393 | $3,244,200 | $1,150,000 | $2,094,200 |
| 2023 | $24,654 | $3,214,300 | $1,150,000 | $2,064,300 |
| 2022 | $24,654 | $3,214,300 | $1,150,000 | $2,064,300 |
| 2021 | $24,975 | $3,214,300 | $1,150,000 | $2,064,300 |
| 2020 | $24,397 | $3,214,300 | $1,150,000 | $2,064,300 |
| 2019 | $25,039 | $3,214,300 | $1,150,000 | $2,064,300 |
| 2018 | $24,943 | $3,214,300 | $1,150,000 | $2,064,300 |
| 2017 | $25,747 | $3,214,300 | $1,150,000 | $2,064,300 |
| 2016 | $24,686 | $3,214,300 | $1,150,000 | $2,064,300 |
| 2015 | $24,750 | $3,214,300 | $1,150,000 | $2,064,300 |
| 2014 | $23,818 | $3,214,300 | $1,150,000 | $2,064,300 |
Source: Public Records
Map
Nearby Homes
- 1 Stone Bridge Ct
- 6 Stone Bridge Ct
- 311 Bellaire Dr
- 32 Litchfield Way
- 114 Bellaire Dr
- 22 Maplewood Rd
- 6 Frick Dr
- 12 Cambridge Way
- 16 Poplar Rd
- 34 Cambridge Way
- 38 Cambridge Way
- 379 Anderson Ave
- 36 Marie Major Dr
- 19 Autumn Terrace
- 91 Macarthur Ave
- 52 Edward St
- 28 Buckingham Dr
- 7 Schaffer Rd
- 19 Academy Ln
- 76 Church St
- 14 Brenner Place
- 20 Brenner Place
- 15 Brenner Place
- 19 Brenner Place
- 8 Brenner Place
- 9 Appletree Ln
- 9 Brenner Place
- 5 Appletree Ln
- 41 Brenner Place
- 41 Brenner Place
- 834 Closter Dock Rd
- 45 Brenner Place
- 842 Closter Dock Rd
- 1 Appletree Ln
- 30 Duane Ln
- 53 Duane Ln
- 45 Duane Ln
- 59 Duane Ln
- 854 Closter Dock Rd
- 850 Closter Dock Rd
Your Personal Tour Guide
Ask me questions while you tour the home.