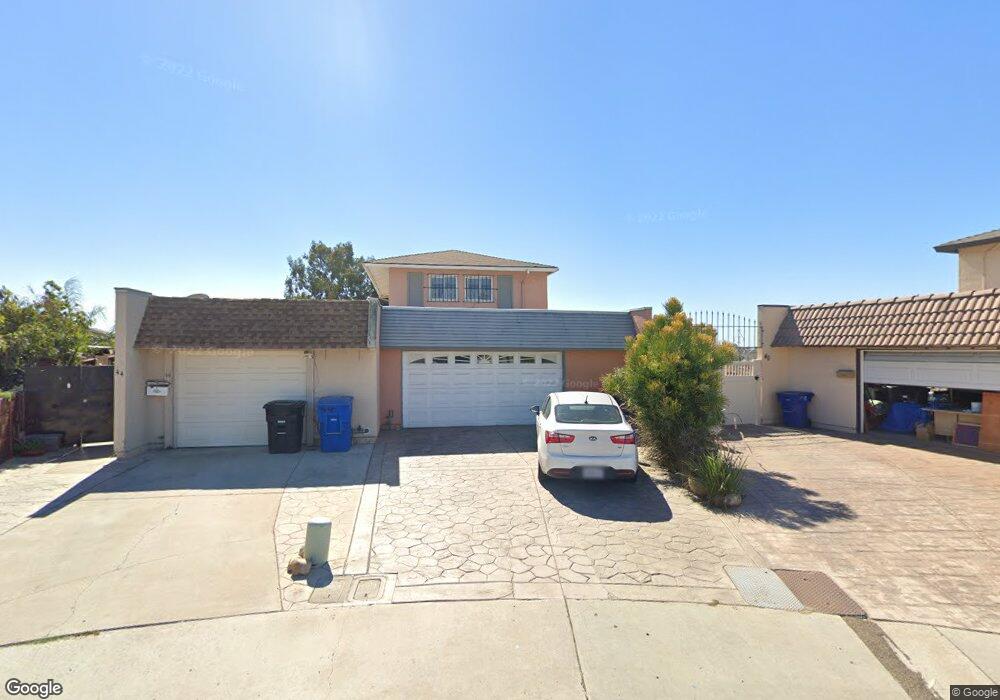
42 Connoley Cir Chula Vista, CA 91911
Otay Town NeighborhoodEstimated Value: $704,000 - $740,000
4
Beds
2
Baths
1,366
Sq Ft
$529/Sq Ft
Est. Value
About This Home
This home is located at 42 Connoley Cir, Chula Vista, CA 91911 and is currently estimated at $722,992, approximately $529 per square foot. 42 Connoley Cir is a home located in San Diego County with nearby schools including Otay Elementary School, Castle Park Middle School, and Castle Park High School.
Ownership History
Date
Name
Owned For
Owner Type
Purchase Details
Closed on
Mar 13, 2023
Sold by
French Cresencia Kimberly
Bought by
K Cresencia Trust and Cresencia
Current Estimated Value
Purchase Details
Closed on
Nov 13, 2020
Sold by
Cresencia Kimberly French and Cresencia Family Revocable Tru
Bought by
Cresencia Kimberly French and Cresencia Steven Mark
Purchase Details
Closed on
Nov 7, 2020
Sold by
French Gregory William
Bought by
Cresencia Kimberly French
Purchase Details
Closed on
Jan 25, 2019
Sold by
Cresencia Steve V and Cresencia Lucrecia R
Bought by
Cresencia Steve V and Cresencia Lucrecia R
Purchase Details
Closed on
Aug 25, 1995
Sold by
Cresencia Esteban V and Cresencia Steve V
Bought by
Cresencia Steve and Cresencia Lucrecia R
Home Financials for this Owner
Home Financials are based on the most recent Mortgage that was taken out on this home.
Original Mortgage
$30,175
Interest Rate
7.63%
Create a Home Valuation Report for This Property
The Home Valuation Report is an in-depth analysis detailing your home's value as well as a comparison with similar homes in the area
Home Values in the Area
Average Home Value in this Area
Purchase History
| Date | Buyer | Sale Price | Title Company |
|---|---|---|---|
| K Cresencia Trust | -- | None Listed On Document | |
| Cresencia Kimberly French | -- | None Available | |
| Cresencia Kimberly French | -- | None Available | |
| Cresencia Steve V | -- | None Available | |
| Cresencia Steve | -- | Southland Title Corporation |
Source: Public Records
Mortgage History
| Date | Status | Borrower | Loan Amount |
|---|---|---|---|
| Previous Owner | Cresencia Steve | $30,175 |
Source: Public Records
Tax History Compared to Growth
Tax History
| Year | Tax Paid | Tax Assessment Tax Assessment Total Assessment is a certain percentage of the fair market value that is determined by local assessors to be the total taxable value of land and additions on the property. | Land | Improvement |
|---|---|---|---|---|
| 2025 | $738 | $61,394 | $14,754 | $46,640 |
| 2024 | $738 | $60,191 | $14,465 | $45,726 |
| 2023 | $727 | $59,012 | $14,182 | $44,830 |
| 2022 | $706 | $57,855 | $13,904 | $43,951 |
| 2021 | $691 | $56,722 | $13,632 | $43,090 |
| 2020 | $595 | $56,142 | $13,493 | $42,649 |
| 2019 | $579 | $55,042 | $13,229 | $41,813 |
| 2018 | $568 | $53,964 | $12,970 | $40,994 |
| 2017 | $555 | $52,907 | $12,716 | $40,191 |
| 2016 | $539 | $51,870 | $12,467 | $39,403 |
| 2015 | $530 | $51,092 | $12,280 | $38,812 |
| 2014 | $521 | $50,092 | $12,040 | $38,052 |
Source: Public Records
Map
Nearby Homes
- 22 Connoley Cir
- 3753-55 Holiday Ct
- 3755 Holiday Ct
- 85 Connoley Cir
- 50 Tamarindo Way
- 121 Orange Ave Unit 33
- 121 Orange Ave Unit 50
- 121 Orange Ave Unit 6
- 121 Orange Ave Unit 5
- 121 Orange Ave Unit 32
- 121 Orange Ave Unit 27
- 121 Orange Ave
- 3965 Otay Valley Rd
- 234 Date St
- 182 Carver St
- 4052 Main St
- 133 Lotus Dr
- 1650 Sycamore Dr
- 1568 Larkhaven Dr
- 1434 Hilltop Dr Unit 35
- 40 Connoley Cir
- 44 Connoley Cir
- 38 Connoley Cir
- 46 Connoley Cir
- 48 Connoley Cir
- 36 Connoley Cir
- 32 Connoley Cir
- 34 Connoley Cir
- 30 Connoley Cir
- 31 Connoley Cir
- 28 Connoley Cir
- 33 Connoley Cir
- 35 Connoley Cir
- 26 Connoley Cir
- 37 Connoley Cir
- 24 Connoley Cir
- 39 Connoley Cir
- 3739 Holiday Ct
- 3731 Holiday Ct
- 41 Connoley Cir