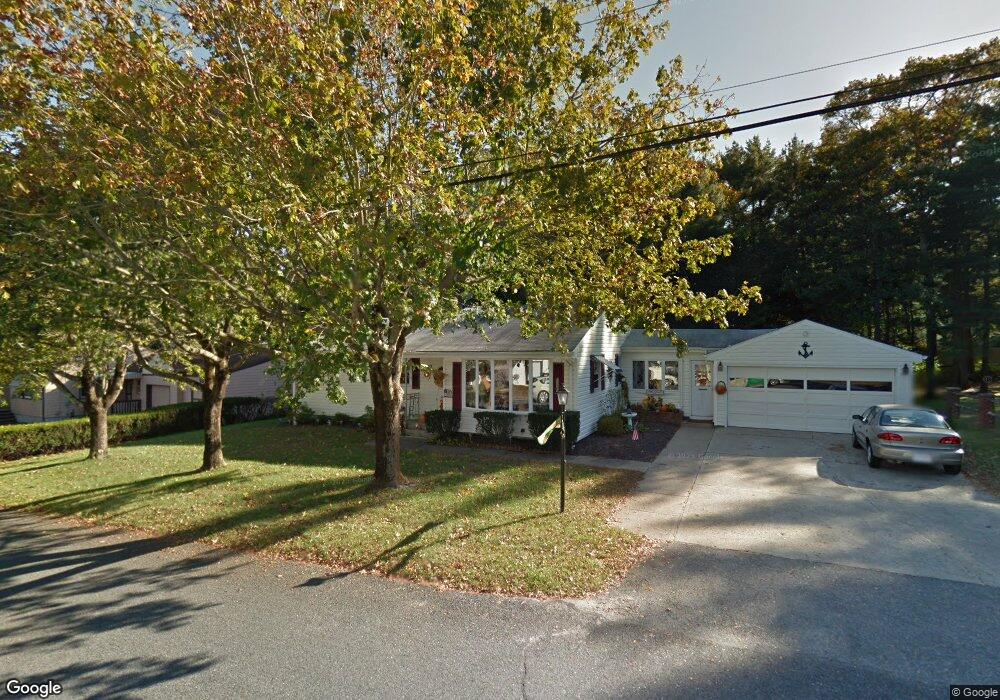
42 E Briggs Rd Westport, MA 02790
North Westport NeighborhoodEstimated Value: $454,000 - $510,000
3
Beds
1
Bath
1,324
Sq Ft
$363/Sq Ft
Est. Value
About This Home
This home is located at 42 E Briggs Rd, Westport, MA 02790 and is currently estimated at $480,714, approximately $363 per square foot. 42 E Briggs Rd is a home located in Bristol County with nearby schools including Alice A. Macomber Primary School, Westport Elementary School, and Westport Middle-High School.
Ownership History
Date
Name
Owned For
Owner Type
Purchase Details
Closed on
Dec 20, 2024
Sold by
Paul Devin J
Bought by
Paul Devin J and Paul Brianna
Current Estimated Value
Purchase Details
Closed on
Jul 10, 2018
Sold by
Paul Devin J
Bought by
Paul Devin J
Purchase Details
Closed on
Nov 4, 2016
Sold by
Pacheco Raymond F and Stokowski Joanne M
Bought by
Paul Devin J and Duarte Tania P
Home Financials for this Owner
Home Financials are based on the most recent Mortgage that was taken out on this home.
Original Mortgage
$235,653
Interest Rate
3.37%
Mortgage Type
FHA
Purchase Details
Closed on
Mar 15, 2010
Sold by
Pacheco Lorraine R
Bought by
Pacheco Raymond F and Stokowski Joanne M
Create a Home Valuation Report for This Property
The Home Valuation Report is an in-depth analysis detailing your home's value as well as a comparison with similar homes in the area
Home Values in the Area
Average Home Value in this Area
Purchase History
| Date | Buyer | Sale Price | Title Company |
|---|---|---|---|
| Paul Devin J | -- | None Available | |
| Paul Devin J | -- | None Available | |
| Paul Devin J | -- | -- | |
| Paul Devin J | $240,000 | -- | |
| Pacheco Raymond F | -- | -- | |
| Paul Devin J | -- | -- | |
| Pacheco Raymond F | -- | -- |
Source: Public Records
Mortgage History
| Date | Status | Borrower | Loan Amount |
|---|---|---|---|
| Previous Owner | Paul Devin J | $235,653 |
Source: Public Records
Tax History
| Year | Tax Paid | Tax Assessment Tax Assessment Total Assessment is a certain percentage of the fair market value that is determined by local assessors to be the total taxable value of land and additions on the property. | Land | Improvement |
|---|---|---|---|---|
| 2025 | $2,686 | $360,500 | $156,800 | $203,700 |
| 2024 | $2,676 | $346,200 | $145,200 | $201,000 |
| 2023 | $2,460 | $301,500 | $132,300 | $169,200 |
| 2022 | $2,240 | $264,100 | $120,300 | $143,800 |
| 2021 | $2,855 | $253,200 | $109,400 | $143,800 |
| 2020 | $2,097 | $248,800 | $105,000 | $143,800 |
| 2019 | $2,020 | $244,200 | $105,000 | $139,200 |
| 2018 | $3,250 | $230,900 | $104,800 | $126,100 |
| 2017 | $3,139 | $225,100 | $101,400 | $123,700 |
| 2016 | $1,664 | $210,400 | $98,100 | $112,300 |
| 2015 | $1,589 | $200,400 | $100,300 | $100,100 |
Source: Public Records
Map
Nearby Homes
- 116 Gifford Rd
- 13 3rd Ave
- 16 Lenox Ave
- 0 Hertitage Acres
- 2 Van Buren St
- 15 S Breault St
- 100 D Dr
- 82-84 O Dr
- 3 Diane Way
- 565 Highland Ave
- 300 Davis Rd
- 1276 Old Fall River Rd
- 358 Briggs Rd
- 343 Old Bedford Rd
- 2 Fieldstone Dr
- 320-322 Old Bedford Rd
- 0 American Legion Hwy Unit 73473517
- 11 Harrison Ct
- 2 Winterberry Ln
- 19 Charles Joseph Dr
Your Personal Tour Guide
Ask me questions while you tour the home.