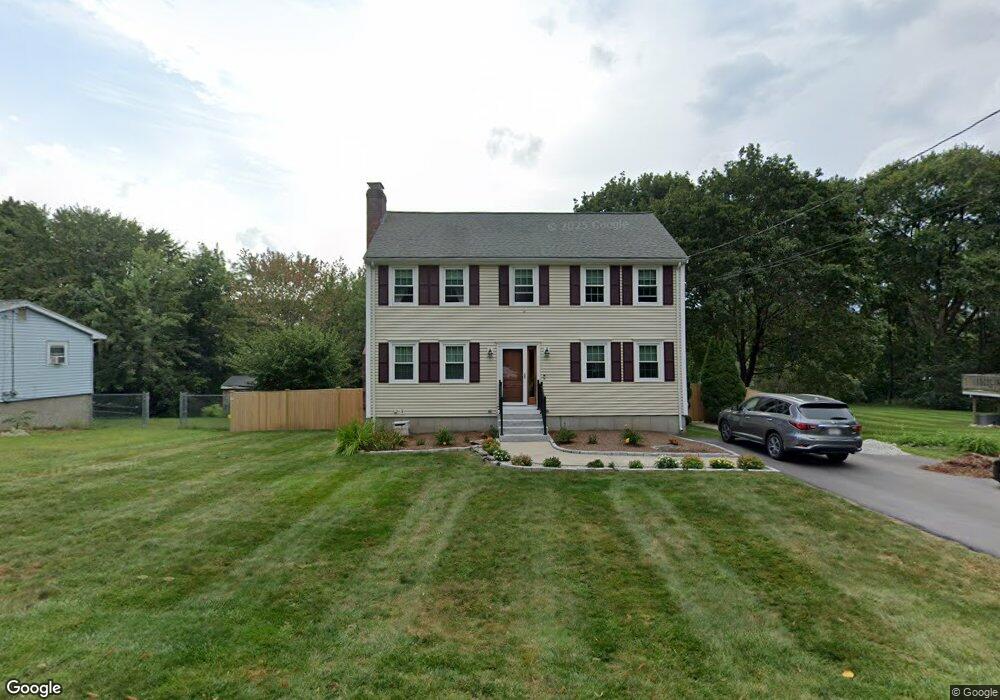
42 Elm St Franklin, MA 02038
Estimated Value: $653,602 - $703,000
3
Beds
2
Baths
1,728
Sq Ft
$390/Sq Ft
Est. Value
About This Home
This home is located at 42 Elm St, Franklin, MA 02038 and is currently estimated at $674,401, approximately $390 per square foot. 42 Elm St is a home located in Norfolk County with nearby schools including Helen Keller Elementary School, Annie Sullivan Middle School, and Franklin High School.
Ownership History
Date
Name
Owned For
Owner Type
Purchase Details
Closed on
Sep 26, 1997
Sold by
Spadafora Christopher and Spadafora Emily L
Bought by
Field Francis A and Field Michelle L
Current Estimated Value
Home Financials for this Owner
Home Financials are based on the most recent Mortgage that was taken out on this home.
Original Mortgage
$164,000
Interest Rate
7.47%
Mortgage Type
Purchase Money Mortgage
Purchase Details
Closed on
Jul 15, 1992
Sold by
W & R Rlty Corp
Bought by
Spadafora Christopher and Spadafora Emily L
Home Financials for this Owner
Home Financials are based on the most recent Mortgage that was taken out on this home.
Original Mortgage
$138,150
Interest Rate
8.54%
Mortgage Type
Purchase Money Mortgage
Create a Home Valuation Report for This Property
The Home Valuation Report is an in-depth analysis detailing your home's value as well as a comparison with similar homes in the area
Home Values in the Area
Average Home Value in this Area
Purchase History
| Date | Buyer | Sale Price | Title Company |
|---|---|---|---|
| Field Francis A | $182,900 | -- | |
| Spadafora Christopher | $153,500 | -- |
Source: Public Records
Mortgage History
| Date | Status | Borrower | Loan Amount |
|---|---|---|---|
| Open | Spadafora Christopher | $200,000 | |
| Closed | Spadafora Christopher | $163,600 | |
| Closed | Spadafora Christopher | $164,000 | |
| Previous Owner | Spadafora Christopher | $138,150 |
Source: Public Records
Tax History Compared to Growth
Tax History
| Year | Tax Paid | Tax Assessment Tax Assessment Total Assessment is a certain percentage of the fair market value that is determined by local assessors to be the total taxable value of land and additions on the property. | Land | Improvement |
|---|---|---|---|---|
| 2025 | $7,053 | $607,000 | $325,800 | $281,200 |
| 2024 | $6,856 | $581,500 | $325,800 | $255,700 |
| 2023 | $6,771 | $538,200 | $282,900 | $255,300 |
| 2022 | $6,171 | $439,200 | $214,300 | $224,900 |
| 2021 | $6,291 | $429,400 | $238,200 | $191,200 |
| 2020 | $5,863 | $404,100 | $222,400 | $181,700 |
| 2019 | $5,810 | $396,300 | $214,600 | $181,700 |
| 2018 | $5,470 | $373,400 | $210,600 | $162,800 |
| 2017 | $5,243 | $359,600 | $196,800 | $162,800 |
| 2016 | $5,232 | $360,800 | $199,600 | $161,200 |
| 2015 | $5,279 | $355,700 | $194,500 | $161,200 |
| 2014 | $4,795 | $331,800 | $170,600 | $161,200 |
Source: Public Records
Map
Nearby Homes
- 0 Elm St
- 7 Gloucester Dr
- 2 Skyline Dr
- 732 Lincoln St
- 841 Lincoln St
- 24 Shayne Rd Unit 219
- 83 Oliver Pond Cir Unit 7
- 91 Oliver Pond Cir Unit 3
- 48 Leanne Way Unit 48
- 14 Sanford St Unit 15
- 9 Sanford St
- 4 Shaw St
- 56 Fuller Place
- 280 Village St Unit D2
- 20 Broad St Unit 6
- 20 Broad St Unit A
- 20 Broad St Unit 4
- 21 Riverside Rd
- 5 Richardson St
- 41 Kimberlee Ave