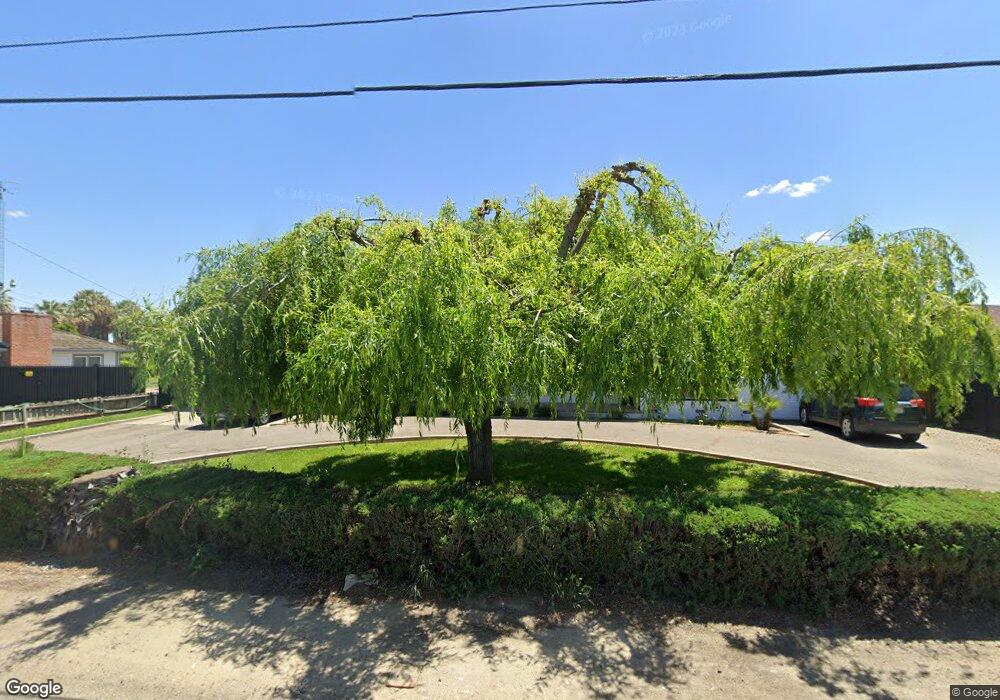
42 Fink Rd Crows Landing, CA 95313
Estimated Value: $289,000 - $513,000
4
Beds
2
Baths
2,042
Sq Ft
$193/Sq Ft
Est. Value
About This Home
This home is located at 42 Fink Rd, Crows Landing, CA 95313 and is currently estimated at $393,354, approximately $192 per square foot. 42 Fink Rd is a home with nearby schools including Orestimba High School.
Ownership History
Date
Name
Owned For
Owner Type
Purchase Details
Closed on
May 15, 2006
Sold by
Virgen Salvador and Virgen Luz Maria
Bought by
Virgen Salvador and Virgen Luz Maria
Current Estimated Value
Home Financials for this Owner
Home Financials are based on the most recent Mortgage that was taken out on this home.
Original Mortgage
$227,500
Outstanding Balance
$140,228
Interest Rate
7.55%
Mortgage Type
Purchase Money Mortgage
Estimated Equity
$253,126
Purchase Details
Closed on
Jun 27, 2001
Sold by
Loo Helen and Loo Revocable Trust
Bought by
Virgin Salvador and Virgin Luz Maria
Home Financials for this Owner
Home Financials are based on the most recent Mortgage that was taken out on this home.
Original Mortgage
$118,937
Interest Rate
7.09%
Mortgage Type
FHA
Purchase Details
Closed on
Feb 17, 1994
Sold by
Loo Helen
Bought by
Loo Helen
Create a Home Valuation Report for This Property
The Home Valuation Report is an in-depth analysis detailing your home's value as well as a comparison with similar homes in the area
Purchase History
| Date | Buyer | Sale Price | Title Company |
|---|---|---|---|
| Virgen Salvador | -- | None Available | |
| Virgin Salvador | $120,000 | Fidelity National Title Co | |
| Loo Helen | -- | -- |
Source: Public Records
Mortgage History
| Date | Status | Borrower | Loan Amount |
|---|---|---|---|
| Open | Virgen Salvador | $227,500 | |
| Previous Owner | Virgin Salvador | $118,937 | |
| Closed | Virgin Salvador | $7,200 |
Source: Public Records
Tax History
| Year | Tax Paid | Tax Assessment Tax Assessment Total Assessment is a certain percentage of the fair market value that is determined by local assessors to be the total taxable value of land and additions on the property. | Land | Improvement |
|---|---|---|---|---|
| 2025 | $2,142 | $177,251 | $67,943 | $109,308 |
| 2024 | $2,088 | $173,776 | $66,611 | $107,165 |
| 2023 | $2,028 | $170,369 | $65,305 | $105,064 |
| 2022 | $1,990 | $167,029 | $64,025 | $103,004 |
| 2021 | $1,950 | $163,755 | $62,770 | $100,985 |
| 2020 | $1,916 | $162,077 | $62,127 | $99,950 |
| 2019 | $1,921 | $158,900 | $60,909 | $97,991 |
| 2018 | $1,799 | $155,785 | $59,715 | $96,070 |
| 2017 | $1,945 | $152,732 | $58,545 | $94,187 |
| 2016 | $1,732 | $149,739 | $57,398 | $92,341 |
| 2015 | $1,783 | $147,490 | $56,536 | $90,954 |
| 2014 | $1,762 | $144,602 | $55,429 | $89,173 |
Source: Public Records
Map
Nearby Homes
- 19054 California 33
- 24 Armstrong Rd
- 18401 Davis Rd
- 0 Draper Rd Unit 26489134
- 18413 Sycamore Ave
- 1137 Apricot Ave
- 13807 Carpenter Rd
- 0 E Stuhr Rd
- 403 Elfers Rd
- 425 Elfers Rd
- 572 St Helena Dr
- 662 Cedar Mountain Dr
- 728 R St
- 751 Banff Dr
- 4060 Orestimba Rd
- 1029 Main St
- 613 Ranee Ct
- 407 Northampton Way
- 1613 Fig Ave
- 507 Lady Slipper Ln
Your Personal Tour Guide
Ask me questions while you tour the home.