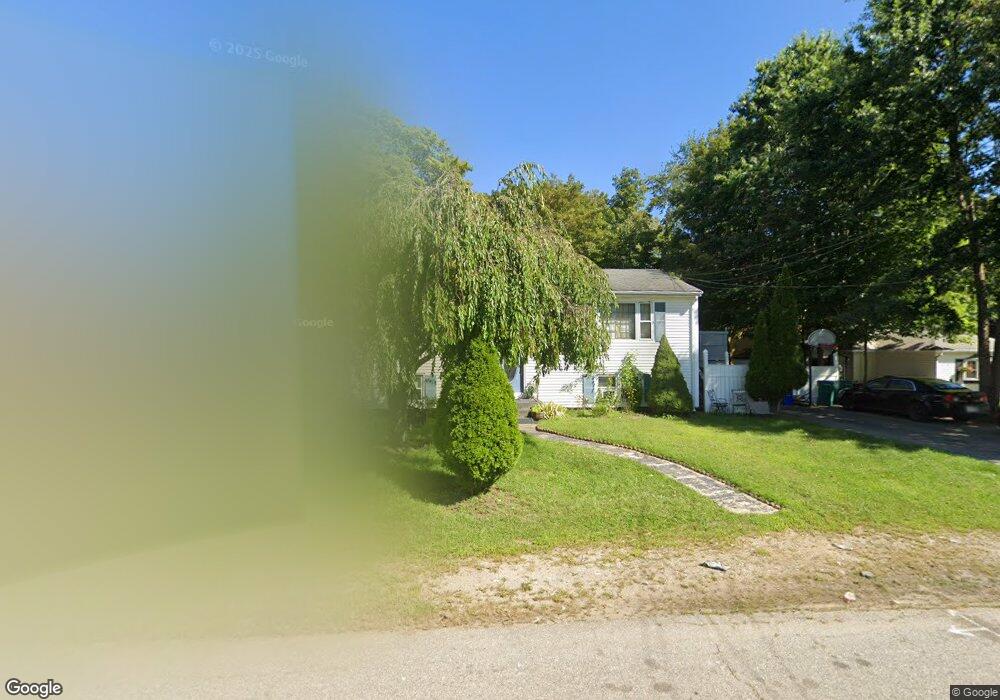
42 Hazel St Attleboro, MA 02703
Estimated Value: $410,000 - $665,000
5
Beds
2
Baths
1,800
Sq Ft
$285/Sq Ft
Est. Value
About This Home
This home is located at 42 Hazel St, Attleboro, MA 02703 and is currently estimated at $513,886, approximately $285 per square foot. 42 Hazel St is a home located in Bristol County with nearby schools including Peter Thacher Elementary School, Wamsutta Middle School, and Attleboro High School.
Ownership History
Date
Name
Owned For
Owner Type
Purchase Details
Closed on
Jan 2, 2008
Sold by
Bank Of New York
Bought by
Salguero Saul
Current Estimated Value
Home Financials for this Owner
Home Financials are based on the most recent Mortgage that was taken out on this home.
Original Mortgage
$169,400
Outstanding Balance
$107,540
Interest Rate
6.27%
Mortgage Type
Purchase Money Mortgage
Estimated Equity
$406,346
Purchase Details
Closed on
Mar 5, 2007
Sold by
Pacheco Lydia and Mers
Bought by
Bank Of New York
Purchase Details
Closed on
Aug 10, 2006
Sold by
Pacheco John and Pacheco Lydia
Bought by
Aponte Ramon
Purchase Details
Closed on
Dec 28, 2000
Sold by
Heroux Douglas W and Heroux Stacy L
Bought by
Pacheco John
Home Financials for this Owner
Home Financials are based on the most recent Mortgage that was taken out on this home.
Original Mortgage
$141,000
Interest Rate
7.7%
Mortgage Type
Purchase Money Mortgage
Create a Home Valuation Report for This Property
The Home Valuation Report is an in-depth analysis detailing your home's value as well as a comparison with similar homes in the area
Home Values in the Area
Average Home Value in this Area
Purchase History
| Date | Buyer | Sale Price | Title Company |
|---|---|---|---|
| Salguero Saul | $220,000 | -- | |
| Bank Of New York | $278,550 | -- | |
| Aponte Ramon | -- | -- | |
| Pacheco John | $148,450 | -- |
Source: Public Records
Mortgage History
| Date | Status | Borrower | Loan Amount |
|---|---|---|---|
| Open | Salguero Saul | $169,400 | |
| Previous Owner | Pacheco John | $152,000 | |
| Previous Owner | Pacheco John | $141,000 |
Source: Public Records
Tax History
| Year | Tax Paid | Tax Assessment Tax Assessment Total Assessment is a certain percentage of the fair market value that is determined by local assessors to be the total taxable value of land and additions on the property. | Land | Improvement |
|---|---|---|---|---|
| 2025 | $4,318 | $344,100 | $118,700 | $225,400 |
| 2024 | $4,305 | $338,200 | $118,700 | $219,500 |
| 2023 | $4,050 | $295,800 | $108,000 | $187,800 |
| 2022 | $3,836 | $265,500 | $102,800 | $162,700 |
| 2021 | $5,703 | $241,000 | $98,900 | $142,100 |
| 2020 | $3,369 | $231,400 | $96,100 | $135,300 |
| 2019 | $5,205 | $224,700 | $94,100 | $130,600 |
| 2018 | $4,796 | $205,600 | $91,400 | $114,200 |
| 2017 | $2,997 | $206,000 | $91,400 | $114,600 |
| 2016 | $2,780 | $187,600 | $85,500 | $102,100 |
| 2015 | $2,745 | $186,600 | $85,500 | $101,100 |
| 2014 | $2,617 | $176,200 | $80,900 | $95,300 |
Source: Public Records
Map
Nearby Homes
- 91 East St
- 43 Maple St
- 61 Pine St Unit 9
- 0 Alvin St (Lot 501)
- 17 Capron St
- 28 Pine St Unit C
- 231 Park St
- 37 Holman St
- 45 Holman St
- 32 Park St Unit 4
- 0 Rosedale Ln Unit 73469293
- 147 County St
- 18-20 Jefferson St
- 21 4th St
- 49 Dennis St
- 64 Mechanic St Unit 3
- 64 Mechanic St
- 75 Dennis St Unit 3
- 10 John St
- 63 Hope St
- 36 Hazel St
- 32 Major St
- 43 Hazel St
- 34 Major St
- 34 Major St Unit 1
- 34 Major St Unit 2
- 47 Hazel St
- 83 East St
- 81 East St
- 35 Hazel St Unit C
- 35 Hazel St Unit A
- 35 Hazel St Unit C,35
- 83 East St Unit 83
- 83 East St Unit 1
- 50 Hazel St
- Lot 6 Ashden Ct
- 40 Major St
- 86 E Street St
- 93 East St Unit 95
- 77 East St
Your Personal Tour Guide
Ask me questions while you tour the home.