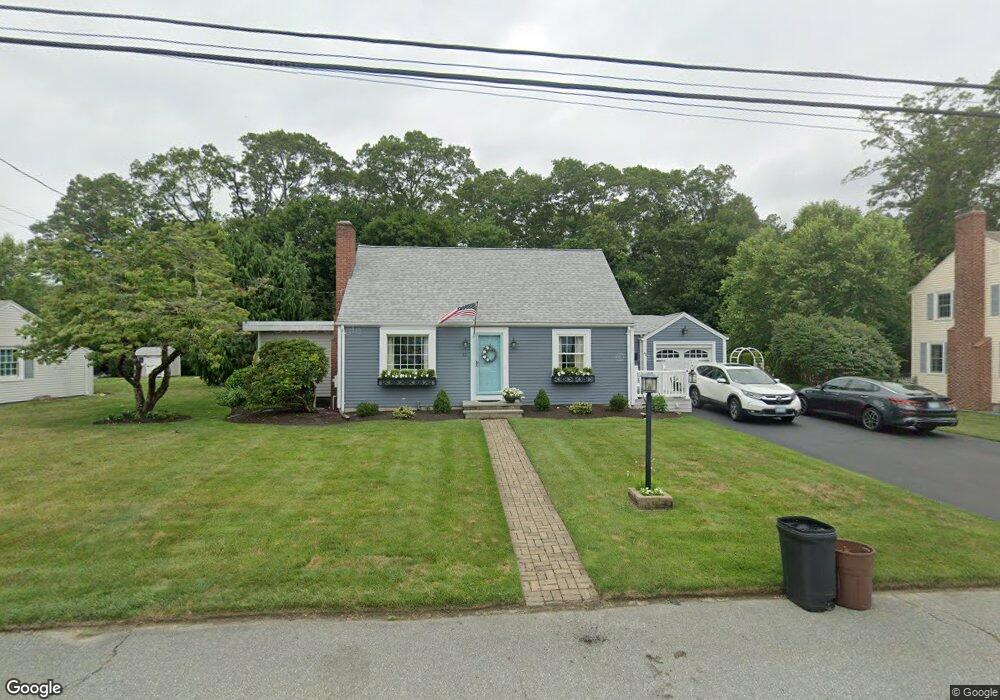
42 Hilltop Dr Cranston, RI 02920
Mayfield NeighborhoodEstimated Value: $493,000 - $549,000
3
Beds
2
Baths
1,746
Sq Ft
$301/Sq Ft
Est. Value
About This Home
This home is located at 42 Hilltop Dr, Cranston, RI 02920 and is currently estimated at $525,338, approximately $300 per square foot. 42 Hilltop Dr is a home located in Providence County with nearby schools including Garden City School, Western Hills Middle School, and Cranston High School West.
Ownership History
Date
Name
Owned For
Owner Type
Purchase Details
Closed on
Nov 6, 2012
Sold by
Sullivan Sean A and Sullivban Deborah A
Bought by
Deborah A Sullivan T and Sullivan Deborah A
Current Estimated Value
Home Financials for this Owner
Home Financials are based on the most recent Mortgage that was taken out on this home.
Original Mortgage
$174,500
Outstanding Balance
$119,046
Interest Rate
3.5%
Mortgage Type
New Conventional
Estimated Equity
$406,292
Purchase Details
Closed on
Jan 18, 2012
Sold by
Deborah A Sullivan T
Bought by
Sullivan Sean A and Sulivan Deborah A
Create a Home Valuation Report for This Property
The Home Valuation Report is an in-depth analysis detailing your home's value as well as a comparison with similar homes in the area
Home Values in the Area
Average Home Value in this Area
Purchase History
| Date | Buyer | Sale Price | Title Company |
|---|---|---|---|
| Deborah A Sullivan T | -- | -- | |
| Sullivan Sean A | -- | -- |
Source: Public Records
Mortgage History
| Date | Status | Borrower | Loan Amount |
|---|---|---|---|
| Open | Sullivan Sean A | $100,000 | |
| Open | Deborah A Sullivan T | $174,500 | |
| Previous Owner | Sullivan Sean A | $28,000 |
Source: Public Records
Tax History
| Year | Tax Paid | Tax Assessment Tax Assessment Total Assessment is a certain percentage of the fair market value that is determined by local assessors to be the total taxable value of land and additions on the property. | Land | Improvement |
|---|---|---|---|---|
| 2025 | $6,217 | $447,900 | $118,800 | $329,100 |
| 2024 | $6,005 | $441,200 | $118,800 | $322,400 |
| 2023 | $5,555 | $293,900 | $78,200 | $215,700 |
| 2022 | $5,440 | $293,900 | $78,200 | $215,700 |
| 2021 | $5,290 | $293,900 | $78,200 | $215,700 |
| 2020 | $4,777 | $230,000 | $74,500 | $155,500 |
| 2019 | $4,777 | $230,000 | $74,500 | $155,500 |
| 2018 | $4,667 | $230,000 | $74,500 | $155,500 |
| 2017 | $4,535 | $197,700 | $67,000 | $130,700 |
| 2016 | $4,438 | $197,700 | $67,000 | $130,700 |
| 2015 | $4,438 | $197,700 | $67,000 | $130,700 |
| 2014 | $3,963 | $173,500 | $67,000 | $106,500 |
Source: Public Records
Map
Nearby Homes
- 20 Hilltop Dr
- 33 Rose Hill Dr
- 14 Amanda St
- 10 East St Unit 316
- 50 Briarwood Rd
- 78 Wilbur Ave
- 20 Manilla Ave
- 1027 Providence St Unit 4B
- 14 W Natick Rd
- 36 Bleachery Ct
- 52 Cottonwood Dr
- 87 Lincoln Park Ave
- 82 Mountain Laurel Dr
- 42 Woodland Dr
- 157 Sweetbriar Dr
- 115 Edman St
- 123 Edman St
- 12 Railroad Row
- 217 Belvedere Dr
- 6 Governors Hill Unit 6
Your Personal Tour Guide
Ask me questions while you tour the home.