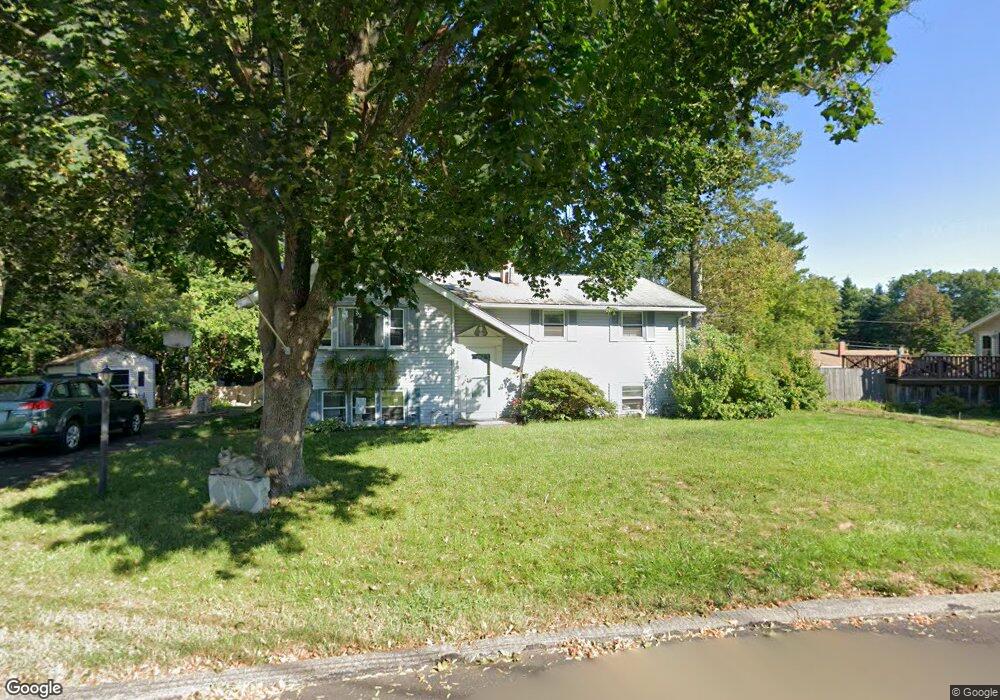
42 Langholm Dr Nashua, NH 03062
Southwest Nashua NeighborhoodEstimated Value: $483,479 - $497,000
4
Beds
2
Baths
1,090
Sq Ft
$450/Sq Ft
Est. Value
About This Home
This home is located at 42 Langholm Dr, Nashua, NH 03062 and is currently estimated at $490,120, approximately $449 per square foot. 42 Langholm Dr is a home located in Hillsborough County with nearby schools including New Searles School, Fairgrounds Middle School, and Nashua High School South.
Ownership History
Date
Name
Owned For
Owner Type
Purchase Details
Closed on
Apr 14, 2021
Sold by
Mayou Richard B and Mayou Fatha A
Bought by
R B Sr & F A Mayou Ret and Mayou
Current Estimated Value
Purchase Details
Closed on
Dec 4, 2018
Sold by
Whitmore Robert S and Whitmore Lisa G
Bought by
Whitmore Robert S
Purchase Details
Closed on
Nov 9, 2018
Sold by
Whitemore Robert S and Whitemore Lisa G
Bought by
Whitemore Robert S
Purchase Details
Closed on
Jun 24, 1977
Bought by
Whitmore Robert S
Create a Home Valuation Report for This Property
The Home Valuation Report is an in-depth analysis detailing your home's value as well as a comparison with similar homes in the area
Home Values in the Area
Average Home Value in this Area
Purchase History
| Date | Buyer | Sale Price | Title Company |
|---|---|---|---|
| R B Sr & F A Mayou Ret | -- | None Available | |
| Whitmore Robert S | -- | -- | |
| Whitemore Robert S | -- | -- | |
| Whitmore Robert S | -- | -- |
Source: Public Records
Mortgage History
| Date | Status | Borrower | Loan Amount |
|---|---|---|---|
| Previous Owner | Whitmore Robert S | $233,160 | |
| Previous Owner | Whitmore Robert S | $231,906 | |
| Previous Owner | Whitmore Robert S | $232,096 |
Source: Public Records
Tax History Compared to Growth
Tax History
| Year | Tax Paid | Tax Assessment Tax Assessment Total Assessment is a certain percentage of the fair market value that is determined by local assessors to be the total taxable value of land and additions on the property. | Land | Improvement |
|---|---|---|---|---|
| 2024 | $7,060 | $444,000 | $164,800 | $279,200 |
| 2023 | $6,645 | $364,500 | $131,900 | $232,600 |
| 2022 | $6,587 | $364,500 | $131,900 | $232,600 |
| 2021 | $5,912 | $254,600 | $87,900 | $166,700 |
| 2020 | $5,757 | $254,600 | $87,900 | $166,700 |
| 2019 | $5,540 | $254,600 | $87,900 | $166,700 |
| 2018 | $5,400 | $254,600 | $87,900 | $166,700 |
| 2017 | $5,287 | $205,000 | $68,300 | $136,700 |
| 2016 | $5,139 | $205,000 | $68,300 | $136,700 |
| 2015 | $5,029 | $205,000 | $68,300 | $136,700 |
| 2014 | $4,930 | $205,000 | $68,300 | $136,700 |
Source: Public Records
Map
Nearby Homes
- 5 Wilderness Dr
- 15 Westray Dr
- 188 Harris Rd
- 31 Tenby Dr
- 33 Cannon Dr
- 375 Main Dunstable Rd
- 57 Wethersfield Rd
- 23 Glen Dr
- 4 Henry David Dr Unit 203
- 29 Greenwood Dr
- 25 Cortez Dr Unit U57
- 16 Laurel Ct Unit U320
- 29 Dickens St
- 51 Legacy Dr
- 285 E Dunstable Rd
- 7 Doucet Ave
- 10 Lamb Rd
- 61 Wilderness Dr
- 18 Cadogan Way Unit UY250
- 59 Wilderness Dr