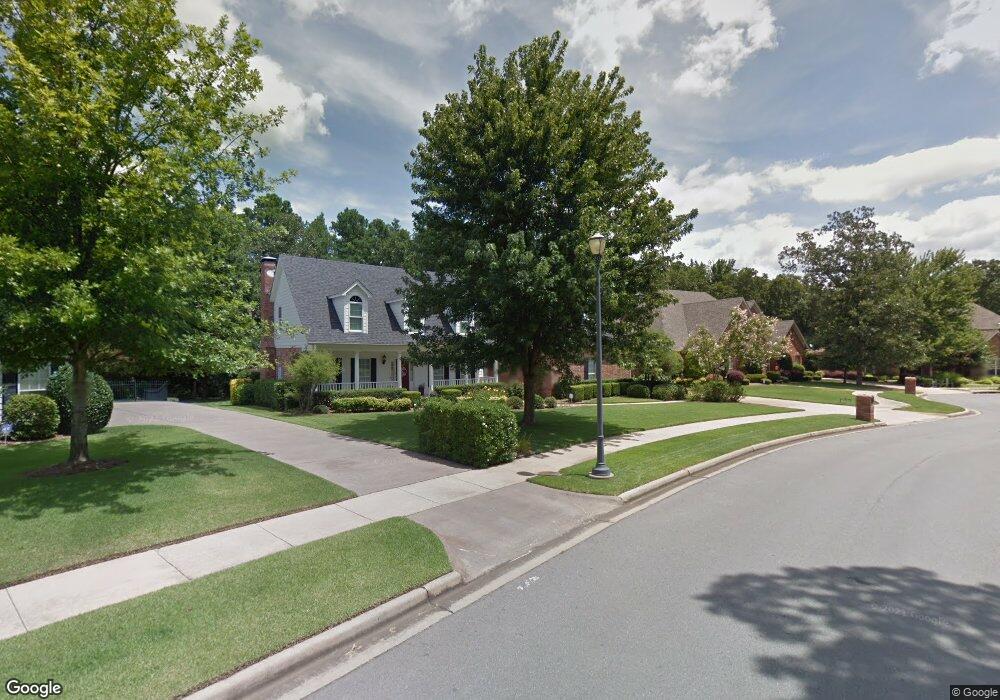
42 Laval Cir Little Rock, AR 72223
Chenal Valley NeighborhoodEstimated Value: $560,185 - $626,000
--
Bed
5
Baths
3,830
Sq Ft
$152/Sq Ft
Est. Value
About This Home
This home is located at 42 Laval Cir, Little Rock, AR 72223 and is currently estimated at $583,796, approximately $152 per square foot. 42 Laval Cir is a home located in Pulaski County with nearby schools including Joe T. Robinson Elementary School, Joe T. Robinson Middle School, and Joe T. Robinson High School.
Ownership History
Date
Name
Owned For
Owner Type
Purchase Details
Closed on
Sep 17, 2021
Sold by
Savers Norman C and Savers Ann C
Bought by
Savers Norman C and Savers Ann C
Current Estimated Value
Purchase Details
Closed on
May 17, 2004
Sold by
Simmons Steven R and Simmons Maria A
Bought by
Savers Norman C and Savers Ann C
Home Financials for this Owner
Home Financials are based on the most recent Mortgage that was taken out on this home.
Original Mortgage
$310,000
Interest Rate
4.5%
Mortgage Type
Purchase Money Mortgage
Purchase Details
Closed on
Nov 21, 2000
Sold by
Randy James Construction Company Inc
Bought by
Simmons Steven R and Simmons Maria A
Home Financials for this Owner
Home Financials are based on the most recent Mortgage that was taken out on this home.
Original Mortgage
$200,000
Interest Rate
7.73%
Mortgage Type
Purchase Money Mortgage
Create a Home Valuation Report for This Property
The Home Valuation Report is an in-depth analysis detailing your home's value as well as a comparison with similar homes in the area
Home Values in the Area
Average Home Value in this Area
Purchase History
| Date | Buyer | Sale Price | Title Company |
|---|---|---|---|
| Savers Norman C | -- | None Listed On Document | |
| Savers Norman C | $390,000 | American Abstract & Title Co | |
| Simmons Steven R | $321,000 | -- |
Source: Public Records
Mortgage History
| Date | Status | Borrower | Loan Amount |
|---|---|---|---|
| Previous Owner | Savers Norman C | $310,000 | |
| Previous Owner | Simmons Steven R | $200,000 |
Source: Public Records
Tax History Compared to Growth
Tax History
| Year | Tax Paid | Tax Assessment Tax Assessment Total Assessment is a certain percentage of the fair market value that is determined by local assessors to be the total taxable value of land and additions on the property. | Land | Improvement |
|---|---|---|---|---|
| 2025 | $4,239 | $89,599 | $16,400 | $73,199 |
| 2024 | $4,239 | $89,599 | $16,400 | $73,199 |
| 2023 | $4,239 | $89,599 | $16,400 | $73,199 |
| 2022 | $4,239 | $89,599 | $16,400 | $73,199 |
| 2021 | $4,272 | $76,990 | $14,000 | $62,990 |
| 2020 | $3,864 | $76,990 | $14,000 | $62,990 |
| 2019 | $3,864 | $76,990 | $14,000 | $62,990 |
| 2018 | $3,889 | $76,990 | $14,000 | $62,990 |
| 2017 | $3,889 | $76,990 | $14,000 | $62,990 |
| 2016 | $4,239 | $73,680 | $12,400 | $61,280 |
| 2015 | $4,272 | $65,929 | $12,400 | $53,529 |
| 2014 | $4,272 | $65,929 | $12,400 | $53,529 |
Source: Public Records
Map
Nearby Homes
- 22 Margeaux Dr
- 44 Durance Dr
- 11 Spring Valley Ln
- 32 Valletta Cir
- 28 Valletta Cir
- 16920 Valley Falls Dr
- Lot 69 Spring Valley Ln
- 21 Longleaf Ln
- 4 Waterview Ct
- 15 Spring Valley Ln
- 16912 Cantrell Rd
- 14 Aberdeen Dr
- 77 Montagne Ct
- 18021 Cantrell Rd
- 10 Valley Crest Ct
- 37 Belles Fleurs Cir
- 31 Rosaires Way
- 123 Falstone Dr
- 126 Falstone Dr
- 119 Falstone Dr