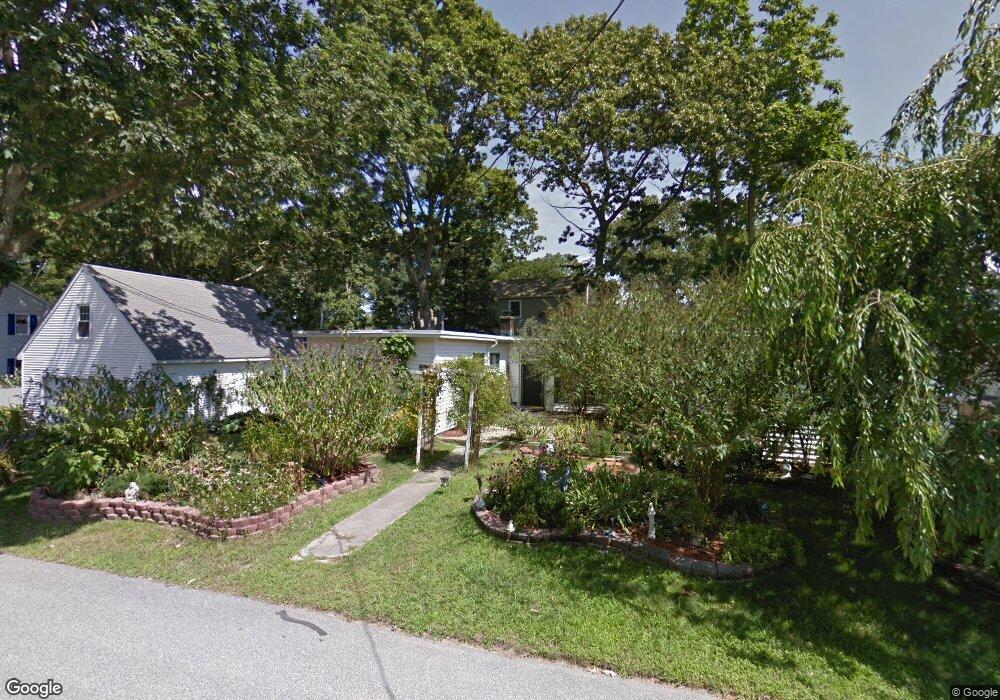
42 Manwaring Rd Niantic, CT 06357
Niantic NeighborhoodEstimated Value: $782,000 - $1,018,000
3
Beds
4
Baths
2,838
Sq Ft
$315/Sq Ft
Est. Value
About This Home
This home is located at 42 Manwaring Rd, Niantic, CT 06357 and is currently estimated at $894,598, approximately $315 per square foot. 42 Manwaring Rd is a home located in New London County with nearby schools including East Lyme Middle School, East Lyme High School, and The Light House Voc-Ed Center.
Ownership History
Date
Name
Owned For
Owner Type
Purchase Details
Closed on
Apr 12, 1990
Sold by
Clement Jesse
Bought by
Horner Trad
Current Estimated Value
Create a Home Valuation Report for This Property
The Home Valuation Report is an in-depth analysis detailing your home's value as well as a comparison with similar homes in the area
Home Values in the Area
Average Home Value in this Area
Purchase History
We collect this data history from publicly available records. To have your information removed, we recommend requesting removal directly through your county’s website.
| Date | Buyer | Sale Price | Title Company |
|---|---|---|---|
| Horner Trad | $133,000 | -- |
Source: Public Records
Mortgage History
We collect this data history from publicly available records. To have your information removed, we recommend requesting removal directly through your county’s website.
| Date | Status | Borrower | Loan Amount |
|---|---|---|---|
| Open | Horner Trad | $138,000 | |
| Open | Horner Trad | $378,000 | |
| Closed | Horner Trad | $350,000 |
Source: Public Records
Tax History
| Year | Tax Paid | Tax Assessment Tax Assessment Total Assessment is a certain percentage of the fair market value that is determined by local assessors to be the total taxable value of land and additions on the property. | Land | Improvement |
|---|---|---|---|---|
| 2025 | $9,225 | $329,350 | $146,510 | $182,840 |
| 2024 | $8,678 | $329,350 | $146,510 | $182,840 |
| 2023 | $8,194 | $329,350 | $146,510 | $182,840 |
| 2022 | $7,852 | $329,350 | $146,510 | $182,840 |
| 2021 | $7,805 | $273,770 | $141,470 | $132,300 |
| 2020 | $7,764 | $273,770 | $141,470 | $132,300 |
| 2019 | $7,718 | $273,770 | $141,470 | $132,300 |
| 2018 | $7,488 | $273,770 | $141,470 | $132,300 |
| 2017 | $7,162 | $273,770 | $141,470 | $132,300 |
| 2016 | $6,570 | $259,070 | $131,390 | $127,680 |
| 2015 | $6,402 | $259,070 | $131,390 | $127,680 |
| 2014 | $6,225 | $259,070 | $131,390 | $127,680 |
Source: Public Records
Map
Nearby Homes
- 36 Attawan Rd
- 150 Black Point Rd
- 61 Terrace Ave
- 14 Old Black Point Rd
- 127 Black Point Rd Unit 31
- 5 Central Ave
- 100 Old Black Point Rd
- 46 Old Black Point Rd
- 11 Sunrise Ave
- 42 Nehantic Dr
- 64 Nehantic Dr
- 61 Whitecap Rd
- 6 Slocum Dr
- 9 Columbus Ave
- 468 Main St Unit 318
- 468 Main St Unit 207
- 468 Main St Unit 111
- 468 Main St Unit 114
- 11 Cottage Ln
- 54 Sea Crest Ave
Your Personal Tour Guide
Ask me questions while you tour the home.