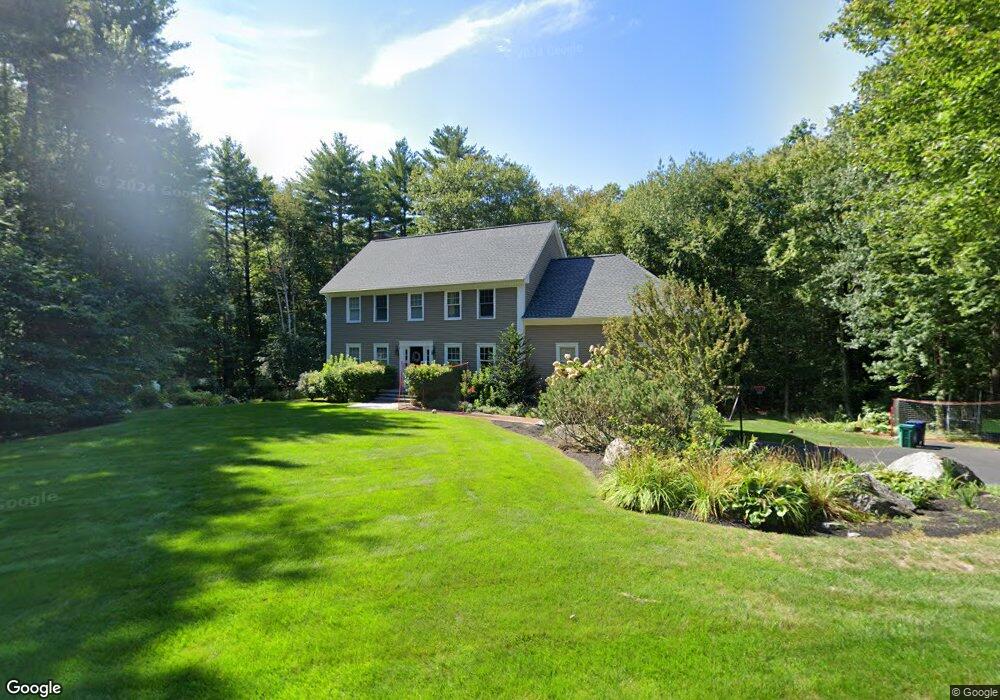
42 Munsey Dr Hampton, NH 03842
Estimated Value: $1,070,000 - $1,232,000
4
Beds
3
Baths
3,002
Sq Ft
$376/Sq Ft
Est. Value
About This Home
This home is located at 42 Munsey Dr, Hampton, NH 03842 and is currently estimated at $1,129,289, approximately $376 per square foot. 42 Munsey Dr is a home located in Rockingham County with nearby schools including North Hampton School, Winnacunnet High School, and Sacred Heart School.
Ownership History
Date
Name
Owned For
Owner Type
Purchase Details
Closed on
Apr 30, 2009
Sold by
Morales Albert R and Miller-Morales Kristin
Bought by
Ciaschini Michael W and Vogel Nicola M
Current Estimated Value
Home Financials for this Owner
Home Financials are based on the most recent Mortgage that was taken out on this home.
Original Mortgage
$417,000
Interest Rate
4.86%
Mortgage Type
Purchase Money Mortgage
Purchase Details
Closed on
Mar 17, 2000
Sold by
Payzant Ret T John R and Payzant Rvkb Carolyn R
Bought by
Morales Albert R and Morales Kristin M
Home Financials for this Owner
Home Financials are based on the most recent Mortgage that was taken out on this home.
Original Mortgage
$312,000
Interest Rate
8.24%
Create a Home Valuation Report for This Property
The Home Valuation Report is an in-depth analysis detailing your home's value as well as a comparison with similar homes in the area
Home Values in the Area
Average Home Value in this Area
Purchase History
| Date | Buyer | Sale Price | Title Company |
|---|---|---|---|
| Ciaschini Michael W | $547,500 | -- | |
| Morales Albert R | $390,000 | -- |
Source: Public Records
Mortgage History
| Date | Status | Borrower | Loan Amount |
|---|---|---|---|
| Open | Morales Albert R | $400,000 | |
| Closed | Morales Albert R | $417,000 | |
| Previous Owner | Morales Albert R | $312,000 |
Source: Public Records
Tax History
| Year | Tax Paid | Tax Assessment Tax Assessment Total Assessment is a certain percentage of the fair market value that is determined by local assessors to be the total taxable value of land and additions on the property. | Land | Improvement |
|---|---|---|---|---|
| 2025 | $11,188 | $908,100 | $320,700 | $587,400 |
| 2024 | $11,188 | $908,100 | $320,700 | $587,400 |
| 2023 | $10,358 | $618,400 | $215,000 | $403,400 |
| 2022 | $9,795 | $618,400 | $215,000 | $403,400 |
| 2021 | $9,795 | $618,400 | $215,000 | $403,400 |
| 2020 | $9,843 | $617,900 | $215,000 | $402,900 |
| 2019 | $9,893 | $617,900 | $215,000 | $402,900 |
| 2018 | $10,374 | $631,800 | $195,800 | $436,000 |
| 2017 | $9,978 | $609,500 | $195,800 | $413,700 |
| 2016 | $9,801 | $609,500 | $195,800 | $413,700 |
| 2015 | $9,386 | $489,900 | $163,300 | $326,600 |
| 2014 | $9,265 | $506,000 | $163,300 | $342,700 |
Source: Public Records
Map
Nearby Homes
- 38 Mill Rd
- 11 Lamson Ln
- 12 Runnymede Dr
- 467 High St Unit 10
- 415 High St Unit 3
- 939 Ocean Blvd Unit 14
- 61 Acorn Rd
- 190 Kings Hwy Unit A1
- 43 Ancient Hwy
- 597R Lafayette Rd Unit 105
- 30 Ancient Hwy
- 6 Rice Terrace
- 10 Mcdermott Rd
- 2 Hilliard Dr
- 407 Lafayette Rd
- 25 Stevens Rd
- 11 Redman St
- 7 Redman St
- 29 Thorwald Ave
- 193 Mill Rd
Your Personal Tour Guide
Ask me questions while you tour the home.