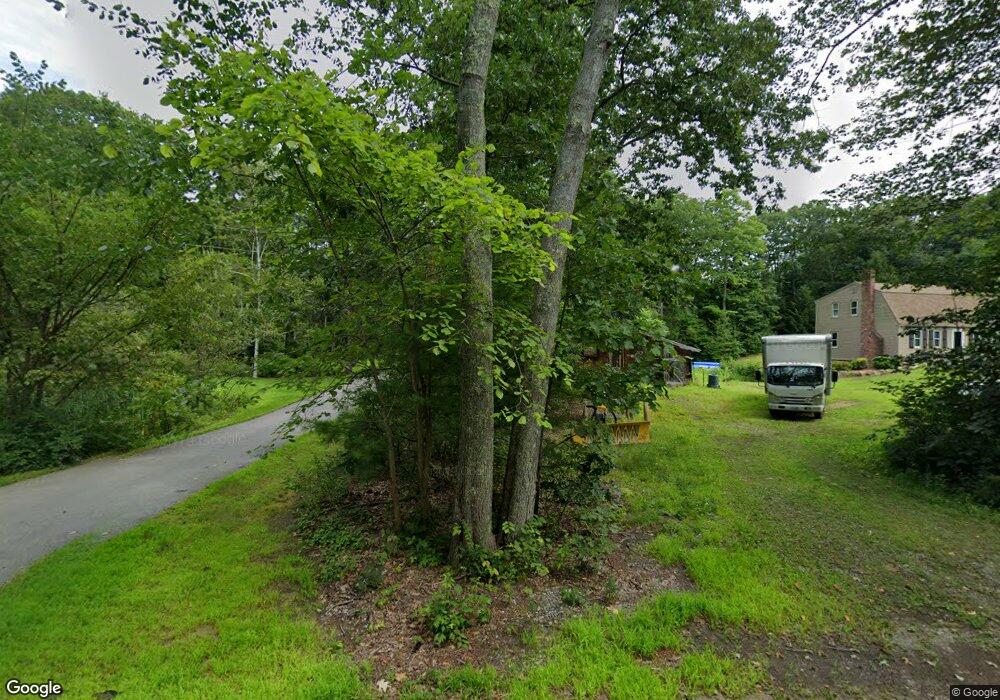
42 North Rd Kingston, NH 03848
Estimated Value: $644,000 - $745,000
3
Beds
2
Baths
2,375
Sq Ft
$292/Sq Ft
Est. Value
About This Home
This home is located at 42 North Rd, Kingston, NH 03848 and is currently estimated at $693,235, approximately $291 per square foot. 42 North Rd is a home located in Rockingham County with nearby schools including Daniel J. Bakie School, Sanborn Regional Middle School, and Sanborn Regional High School.
Ownership History
Date
Name
Owned For
Owner Type
Purchase Details
Closed on
Sep 13, 2019
Sold by
Bowen Andrew P and Bowen Geri Lyn
Bought by
Bowen Ft
Current Estimated Value
Purchase Details
Closed on
Jun 25, 1999
Sold by
Fairbrother Robert C and Fairbrother Rita L
Bought by
Bowen Andrew P and Bowen Geri-Lyn
Home Financials for this Owner
Home Financials are based on the most recent Mortgage that was taken out on this home.
Original Mortgage
$183,200
Interest Rate
7.09%
Create a Home Valuation Report for This Property
The Home Valuation Report is an in-depth analysis detailing your home's value as well as a comparison with similar homes in the area
Home Values in the Area
Average Home Value in this Area
Purchase History
| Date | Buyer | Sale Price | Title Company |
|---|---|---|---|
| Bowen Ft | -- | -- | |
| Bowen Andrew P | $229,000 | -- |
Source: Public Records
Mortgage History
| Date | Status | Borrower | Loan Amount |
|---|---|---|---|
| Previous Owner | Bowen Andrew P | $137,000 | |
| Previous Owner | Bowen Andrew P | $60,000 | |
| Previous Owner | Bowen Andrew P | $183,200 |
Source: Public Records
Tax History Compared to Growth
Tax History
| Year | Tax Paid | Tax Assessment Tax Assessment Total Assessment is a certain percentage of the fair market value that is determined by local assessors to be the total taxable value of land and additions on the property. | Land | Improvement |
|---|---|---|---|---|
| 2024 | $9,155 | $551,200 | $162,600 | $388,600 |
| 2023 | $8,698 | $551,200 | $162,600 | $388,600 |
| 2022 | $7,721 | $340,000 | $100,300 | $239,700 |
| 2020 | $7,099 | $340,000 | $100,300 | $239,700 |
| 2019 | $7,480 | $340,000 | $100,300 | $239,700 |
| 2018 | $7,154 | $340,000 | $100,300 | $239,700 |
| 2017 | $7,038 | $273,000 | $89,900 | $183,100 |
| 2016 | $6,962 | $273,000 | $89,900 | $183,100 |
| 2015 | $7,082 | $273,000 | $89,900 | $183,100 |
| 2014 | $6,885 | $273,000 | $89,900 | $183,100 |
| 2013 | $6,628 | $273,000 | $89,900 | $183,100 |
Source: Public Records
Map
Nearby Homes