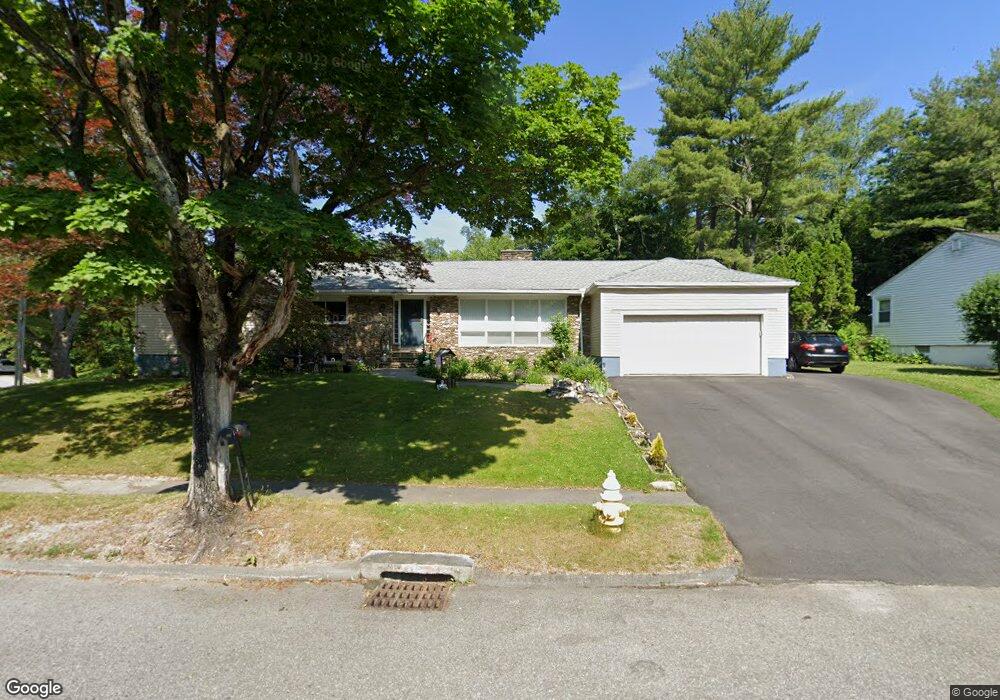
42 Pine Tree Dr Worcester, MA 01609
Salisbury Street NeighborhoodEstimated Value: $566,652 - $622,000
6
Beds
4
Baths
2,302
Sq Ft
$259/Sq Ft
Est. Value
About This Home
This home is located at 42 Pine Tree Dr, Worcester, MA 01609 and is currently estimated at $596,913, approximately $259 per square foot. 42 Pine Tree Dr is a home located in Worcester County with nearby schools including Chandler Magnet, Jacob Hiatt Magnet School, and Flagg Street School.
Ownership History
Date
Name
Owned For
Owner Type
Purchase Details
Closed on
Mar 9, 2012
Sold by
Witkes Gary
Bought by
Shabo Daniel and Shabo Edward
Current Estimated Value
Purchase Details
Closed on
Mar 16, 2006
Sold by
Shaw Joel B
Bought by
Witkes Gary
Home Financials for this Owner
Home Financials are based on the most recent Mortgage that was taken out on this home.
Original Mortgage
$132,000
Interest Rate
6.27%
Mortgage Type
Purchase Money Mortgage
Purchase Details
Closed on
Sep 15, 1999
Sold by
42 Pine Tree T and Chana-Shkedi Sara
Bought by
Shaw Joel B
Home Financials for this Owner
Home Financials are based on the most recent Mortgage that was taken out on this home.
Original Mortgage
$148,000
Interest Rate
7.83%
Mortgage Type
Purchase Money Mortgage
Purchase Details
Closed on
Aug 10, 1992
Sold by
42 Rt
Bought by
42 Pine Treet Tr
Purchase Details
Closed on
Jun 26, 1987
Sold by
Dworman Ralph M
Bought by
Dworman R M
Create a Home Valuation Report for This Property
The Home Valuation Report is an in-depth analysis detailing your home's value as well as a comparison with similar homes in the area
Home Values in the Area
Average Home Value in this Area
Purchase History
| Date | Buyer | Sale Price | Title Company |
|---|---|---|---|
| Shabo Daniel | $169,000 | -- | |
| Witkes Gary | $165,000 | -- | |
| Shaw Joel B | $185,000 | -- | |
| 42 Pine Treet Tr | $188,500 | -- | |
| Dworman R M | $81,500 | -- |
Source: Public Records
Mortgage History
| Date | Status | Borrower | Loan Amount |
|---|---|---|---|
| Previous Owner | Witkes Gary | $132,000 | |
| Previous Owner | Dworman R M | $148,000 | |
| Previous Owner | Dworman R M | $110,000 | |
| Previous Owner | Dworman R M | $125,000 |
Source: Public Records
Tax History
| Year | Tax Paid | Tax Assessment Tax Assessment Total Assessment is a certain percentage of the fair market value that is determined by local assessors to be the total taxable value of land and additions on the property. | Land | Improvement |
|---|---|---|---|---|
| 2025 | $6,110 | $463,200 | $118,900 | $344,300 |
| 2024 | $5,948 | $432,600 | $118,900 | $313,700 |
| 2023 | $5,785 | $403,400 | $103,400 | $300,000 |
| 2022 | $5,147 | $338,400 | $82,700 | $255,700 |
| 2021 | $5,271 | $323,800 | $66,200 | $257,600 |
| 2020 | $5,025 | $295,600 | $66,200 | $229,400 |
| 2019 | $4,718 | $262,100 | $59,700 | $202,400 |
| 2018 | $4,542 | $240,200 | $59,700 | $180,500 |
| 2017 | $4,790 | $249,200 | $59,700 | $189,500 |
| 2016 | $4,792 | $232,500 | $44,300 | $188,200 |
| 2015 | $4,666 | $232,500 | $44,300 | $188,200 |
| 2014 | $4,543 | $232,500 | $44,300 | $188,200 |
Source: Public Records
Map
Nearby Homes
- 40 Pine Tree Dr
- 3 Valley Hill Ln
- 3 Valley Hill Ln
- 37 Valley Hill Dr
- 43 Pine Tree Dr
- 35 Valley Hill Dr
- 38 Pine Tree Dr
- 39 Valley Hill Dr
- 45 Pine Tree Dr
- 41 Pine Tree Dr
- 4 Valley Hill Ln
- 33 Valley Hill Dr
- 4 Pine Tree Ln
- 41 Valley Hill Dr
- 36 Pine Tree Dr
- 2 Valley Hill Ln
- 2 Valley Hill Ln
- 30 Sun Valley Dr
- 28 Sun Valley Dr
- 31 Valley Hill Dr
Your Personal Tour Guide
Ask me questions while you tour the home.