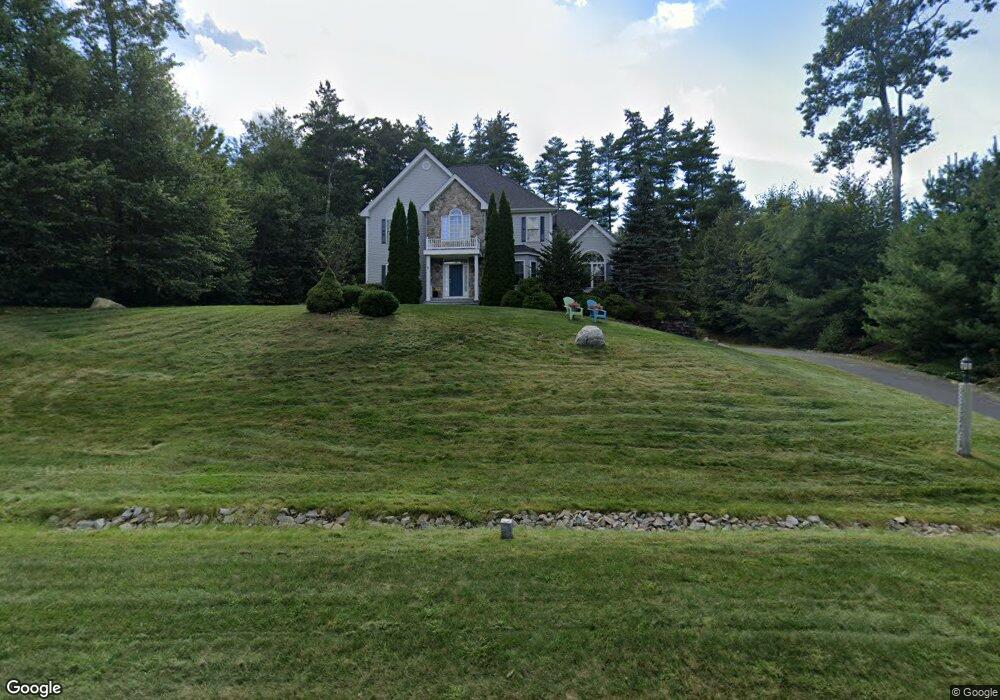
42 Post Rd Hooksett, NH 03106
Estimated Value: $840,000 - $1,005,000
3
Beds
3
Baths
2,968
Sq Ft
$311/Sq Ft
Est. Value
About This Home
This home is located at 42 Post Rd, Hooksett, NH 03106 and is currently estimated at $922,820, approximately $310 per square foot. 42 Post Rd is a home located in Merrimack County with nearby schools including Fred C. Underhill School, Hooksett Memorial School, and David R. Cawley Middle School.
Ownership History
Date
Name
Owned For
Owner Type
Purchase Details
Closed on
Dec 7, 2005
Sold by
Sand Manchester
Bought by
Mcwilliams Alison
Current Estimated Value
Home Financials for this Owner
Home Financials are based on the most recent Mortgage that was taken out on this home.
Original Mortgage
$466,860
Interest Rate
6.17%
Mortgage Type
Adjustable Rate Mortgage/ARM
Create a Home Valuation Report for This Property
The Home Valuation Report is an in-depth analysis detailing your home's value as well as a comparison with similar homes in the area
Home Values in the Area
Average Home Value in this Area
Purchase History
| Date | Buyer | Sale Price | Title Company |
|---|---|---|---|
| Mcwilliams Alison | $140,000 | -- | |
| Mcwilliams Alison | $140,000 | -- |
Source: Public Records
Mortgage History
| Date | Status | Borrower | Loan Amount |
|---|---|---|---|
| Open | Mcwilliams Alison | $346,000 | |
| Closed | Mcwilliams Alison | $466,860 |
Source: Public Records
Tax History
| Year | Tax Paid | Tax Assessment Tax Assessment Total Assessment is a certain percentage of the fair market value that is determined by local assessors to be the total taxable value of land and additions on the property. | Land | Improvement |
|---|---|---|---|---|
| 2024 | $15,083 | $889,300 | $183,400 | $705,900 |
| 2023 | $14,211 | $889,300 | $183,400 | $705,900 |
| 2022 | $12,097 | $503,000 | $125,200 | $377,800 |
| 2021 | $11,177 | $503,000 | $125,200 | $377,800 |
| 2020 | $11,323 | $503,000 | $125,200 | $377,800 |
| 2019 | $10,840 | $503,000 | $125,200 | $377,800 |
| 2018 | $11,126 | $503,000 | $125,200 | $377,800 |
| 2017 | $11,097 | $415,000 | $105,900 | $309,100 |
| 2016 | $10,952 | $415,000 | $105,900 | $309,100 |
| 2015 | $2,581 | $415,000 | $105,900 | $309,100 |
| 2014 | $2,705 | $415,000 | $105,900 | $309,100 |
| 2013 | -- | $415,000 | $105,900 | $309,100 |
Source: Public Records
Map
Nearby Homes
- 59 Post Rd
- 1821 Hooksett Rd
- 12 Chase St
- 131 Merrimack St
- 117 Merrimack St
- 8 Short Ave
- 8 Park St
- 0 Chester Turnpike Unit 18
- 15 Sullivan Dr
- 26 Parkwood Dr
- 7 Oak St
- 19 Sullivan Dr
- 0 Granite St Unit 48
- 422 Dawn Dr Unit 23
- 427 Dawn Dr Unit 15
- 1601 Hooksett Rd
- 430 Dawn Dr Unit 20
- 2 Brandywine Dr
- 27 River Rd
- 1465 Hooksett Rd Unit 418
Your Personal Tour Guide
Ask me questions while you tour the home.