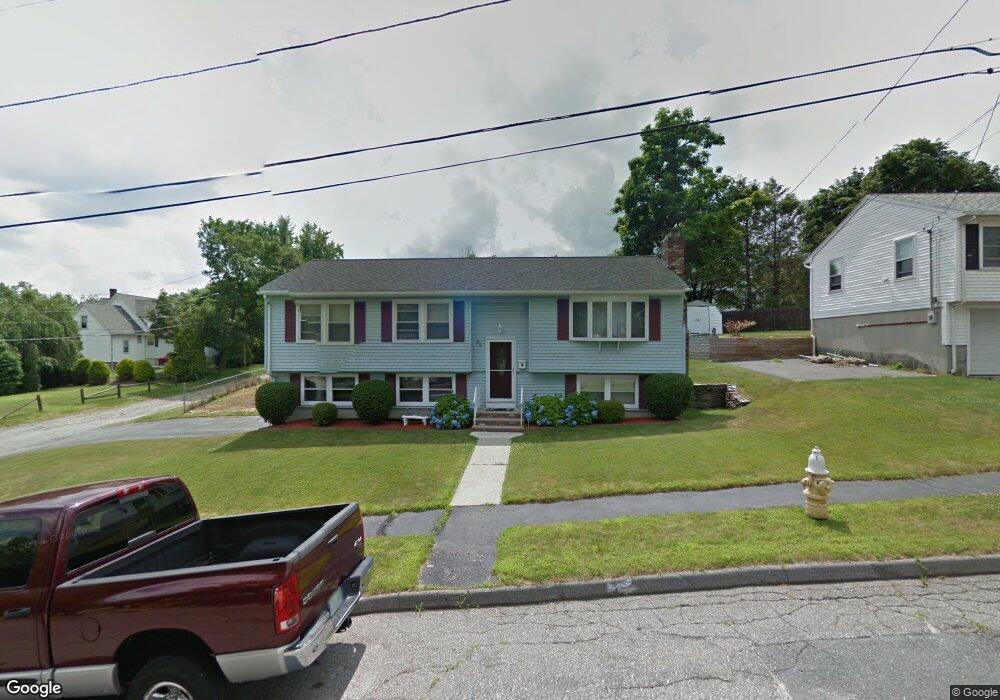
42 Robin Rd Worcester, MA 01604
Hamilton NeighborhoodEstimated Value: $420,000 - $492,000
3
Beds
2
Baths
1,190
Sq Ft
$383/Sq Ft
Est. Value
About This Home
This home is located at 42 Robin Rd, Worcester, MA 01604 and is currently estimated at $456,147, approximately $383 per square foot. 42 Robin Rd is a home located in Worcester County with nearby schools including Jacob Hiatt Magnet School, Chandler Magnet, and Rice Square Elementary School.
Ownership History
Date
Name
Owned For
Owner Type
Purchase Details
Closed on
Oct 28, 2005
Sold by
Fedele Debra A and Fedele Joseph J
Bought by
Sampson Daniel J and Sampson Mary F
Current Estimated Value
Home Financials for this Owner
Home Financials are based on the most recent Mortgage that was taken out on this home.
Original Mortgage
$248,000
Outstanding Balance
$133,800
Interest Rate
5.79%
Mortgage Type
Purchase Money Mortgage
Estimated Equity
$322,347
Purchase Details
Closed on
Jun 1, 1987
Sold by
Hayeck Bldt & Rlty
Bought by
Campbell Herbert J
Home Financials for this Owner
Home Financials are based on the most recent Mortgage that was taken out on this home.
Original Mortgage
$90,000
Interest Rate
10.25%
Mortgage Type
Purchase Money Mortgage
Create a Home Valuation Report for This Property
The Home Valuation Report is an in-depth analysis detailing your home's value as well as a comparison with similar homes in the area
Home Values in the Area
Average Home Value in this Area
Purchase History
| Date | Buyer | Sale Price | Title Company |
|---|---|---|---|
| Sampson Daniel J | $310,000 | -- | |
| Campbell Herbert J | $115,750 | -- |
Source: Public Records
Mortgage History
| Date | Status | Borrower | Loan Amount |
|---|---|---|---|
| Open | Sampson Daniel J | $248,000 | |
| Previous Owner | Campbell Herbert J | $122,500 | |
| Previous Owner | Campbell Herbert J | $123,500 | |
| Previous Owner | Campbell Herbert J | $87,500 | |
| Previous Owner | Campbell Herbert J | $90,000 |
Source: Public Records
Tax History
| Year | Tax Paid | Tax Assessment Tax Assessment Total Assessment is a certain percentage of the fair market value that is determined by local assessors to be the total taxable value of land and additions on the property. | Land | Improvement |
|---|---|---|---|---|
| 2025 | $5,327 | $403,900 | $117,700 | $286,200 |
| 2024 | $5,215 | $379,300 | $117,700 | $261,600 |
| 2023 | $5,079 | $354,200 | $102,300 | $251,900 |
| 2022 | $4,479 | $294,500 | $81,900 | $212,600 |
| 2021 | $638 | $270,400 | $65,500 | $204,900 |
| 2020 | $639 | $247,400 | $65,500 | $181,900 |
| 2019 | $4,104 | $228,000 | $58,900 | $169,100 |
| 2018 | $203 | $218,100 | $58,900 | $159,200 |
| 2017 | $202 | $205,700 | $58,900 | $146,800 |
| 2016 | $3,883 | $188,400 | $42,800 | $145,600 |
| 2015 | $3,781 | $188,400 | $42,800 | $145,600 |
| 2014 | $3,681 | $188,400 | $42,800 | $145,600 |
Source: Public Records
Map
Nearby Homes
- 34 Robin Rd
- 68 Dartmouth St
- 24 Ingleside Ave
- 155 Hamilton St Unit 4
- 103 Hamilton St
- 80 Delmont Ave
- 115 Orient St
- 13 Groton Place
- 5 Mcfarland Ct
- 143 Dorcester
- 15 Houghton St Unit 9
- 429 Grafton St Unit 2
- 247 Shrewsbury St
- 57 Cutler St
- 360 Hamilton St
- 9 Barclay St
- 1 Verdi Rd
- 112 Harrison St
- 21 Mott St
- 29 Chilmark St
Your Personal Tour Guide
Ask me questions while you tour the home.