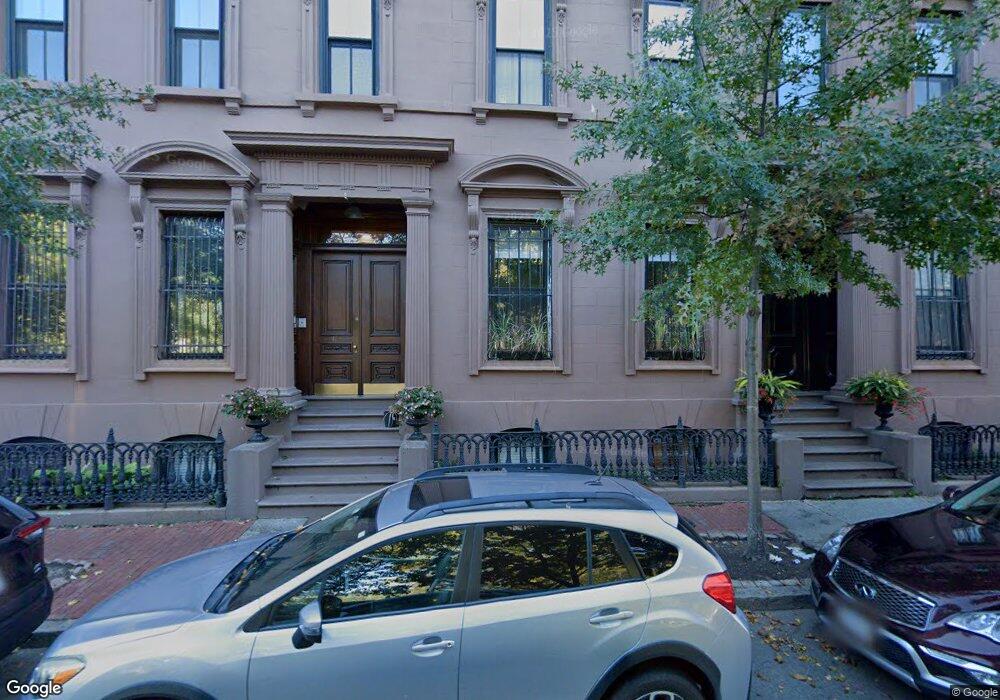
42 W Newton St Unit 3-19 Boston, MA 02118
South End NeighborhoodEstimated Value: $667,526 - $842,000
1
Bed
1
Bath
563
Sq Ft
$1,296/Sq Ft
Est. Value
About This Home
This home is located at 42 W Newton St Unit 3-19, Boston, MA 02118 and is currently estimated at $729,632, approximately $1,295 per square foot. 42 W Newton St Unit 3-19 is a home located in Suffolk County with nearby schools including Edward M. Kennedy Academy for Health Careers, Kingsley Montessori School, and Cathedral High School.
Ownership History
Date
Name
Owned For
Owner Type
Purchase Details
Closed on
Jan 16, 2015
Sold by
Ambrosio Kristin D
Bought by
Navarro-Loro Victor M
Current Estimated Value
Home Financials for this Owner
Home Financials are based on the most recent Mortgage that was taken out on this home.
Original Mortgage
$352,500
Outstanding Balance
$270,027
Interest Rate
4%
Mortgage Type
Adjustable Rate Mortgage/ARM
Estimated Equity
$459,605
Purchase Details
Closed on
Jun 30, 2008
Sold by
Winnick Jamie A
Bought by
Dambrosio Kristin
Home Financials for this Owner
Home Financials are based on the most recent Mortgage that was taken out on this home.
Original Mortgage
$353,875
Interest Rate
6.07%
Mortgage Type
Purchase Money Mortgage
Purchase Details
Closed on
Jan 28, 2005
Sold by
Sweeney Daniel
Bought by
Winnick Jamie A
Purchase Details
Closed on
Apr 2, 1997
Sold by
Mcmanus Terrence and Mcmanus Rita A
Bought by
Sweeney Daniel
Purchase Details
Closed on
May 1, 1991
Sold by
West Newton Units Rt
Bought by
Mcandrew Rita A
Create a Home Valuation Report for This Property
The Home Valuation Report is an in-depth analysis detailing your home's value as well as a comparison with similar homes in the area
Home Values in the Area
Average Home Value in this Area
Purchase History
| Date | Buyer | Sale Price | Title Company |
|---|---|---|---|
| Navarro-Loro Victor M | $470,000 | -- | |
| Navarro-Loro Victor M | $470,000 | -- | |
| Dambrosio Kristin | $372,500 | -- | |
| Dambrosio Kristin | $372,500 | -- | |
| Dambrosio Kristin | $372,500 | -- | |
| Winnick Jamie A | $360,000 | -- | |
| Winnick Jamie A | $360,000 | -- | |
| Sweeney Daniel | $110,000 | -- | |
| Sweeney Daniel | $110,000 | -- | |
| Mcandrew Rita A | $93,000 | -- | |
| Mcandrew Rita A | $93,000 | -- |
Source: Public Records
Mortgage History
| Date | Status | Borrower | Loan Amount |
|---|---|---|---|
| Open | Navarro-Loro Victor M | $352,500 | |
| Closed | Navarro-Loro Victor M | $352,500 | |
| Previous Owner | Dambrosio Kristin | $353,875 |
Source: Public Records
Tax History Compared to Growth
Tax History
| Year | Tax Paid | Tax Assessment Tax Assessment Total Assessment is a certain percentage of the fair market value that is determined by local assessors to be the total taxable value of land and additions on the property. | Land | Improvement |
|---|---|---|---|---|
| 2025 | $7,221 | $623,600 | $0 | $623,600 |
| 2024 | $6,597 | $605,200 | $0 | $605,200 |
| 2023 | $6,370 | $593,100 | $0 | $593,100 |
| 2022 | $6,390 | $587,300 | $0 | $587,300 |
| 2021 | $6,144 | $575,800 | $0 | $575,800 |
| 2020 | $5,952 | $563,600 | $0 | $563,600 |
| 2019 | $5,766 | $547,100 | $0 | $547,100 |
| 2018 | $5,407 | $515,900 | $0 | $515,900 |
| 2017 | $5,204 | $491,400 | $0 | $491,400 |
| 2016 | $5,198 | $472,500 | $0 | $472,500 |
| 2015 | $4,765 | $393,500 | $0 | $393,500 |
| 2014 | $4,492 | $357,100 | $0 | $357,100 |
Source: Public Records
Map
Nearby Homes
- 43 W Newton St Unit 1-10
- 2 Cumston St
- 35-43 Rutland St
- 476 Shawmut Ave Unit 3
- 125 W Concord St Unit 1
- 116 W Concord St Unit PH
- 43 Worcester St Unit 1
- 1666 Washington St Unit 2
- 71 Rutland St Unit 4
- 75 Rutland St Unit 1
- 379 Shawmut Ave
- 771 Harrison Ave Unit 6G
- 771 Harrison Ave Unit 304
- 771 Harrison Ave Unit 207
- 771 Harrison Ave Unit PH612
- 771 Harrison Ave Unit 9G
- 377 Shawmut Ave
- 67 Worcester St Unit 1
- 668 Tremont St Unit 3
- 99 + 101 W Springfield St
- 42 W Newton St Unit 3-18
- 42 W Newton St Unit 2-14
- 42 W Newton St Unit 4-23
- 43 W Newton St Unit 2-16
- 42 W Newton St Unit PH
- 42 W Newton St Unit A27
- 42 W Newton St Unit B5
- 42 W Newton St Unit 1-8
- 42 W Newton St
- 42 W Newton St Unit PH-26
- 43 W Newton St Unit 1-11
- 43 W Newton St Unit 2-15
- 42 W Newton St Unit 4
- 43 W Newton St Unit 43
- 42 W Newton St Unit 42
- 42 W Newton St Unit A26
- 42 W Newton St Unit 2-13
- 42 W Newton St Unit 1-9
- 42 W Newton St Unit 9-1
- 42 W Newton St Unit 3-20