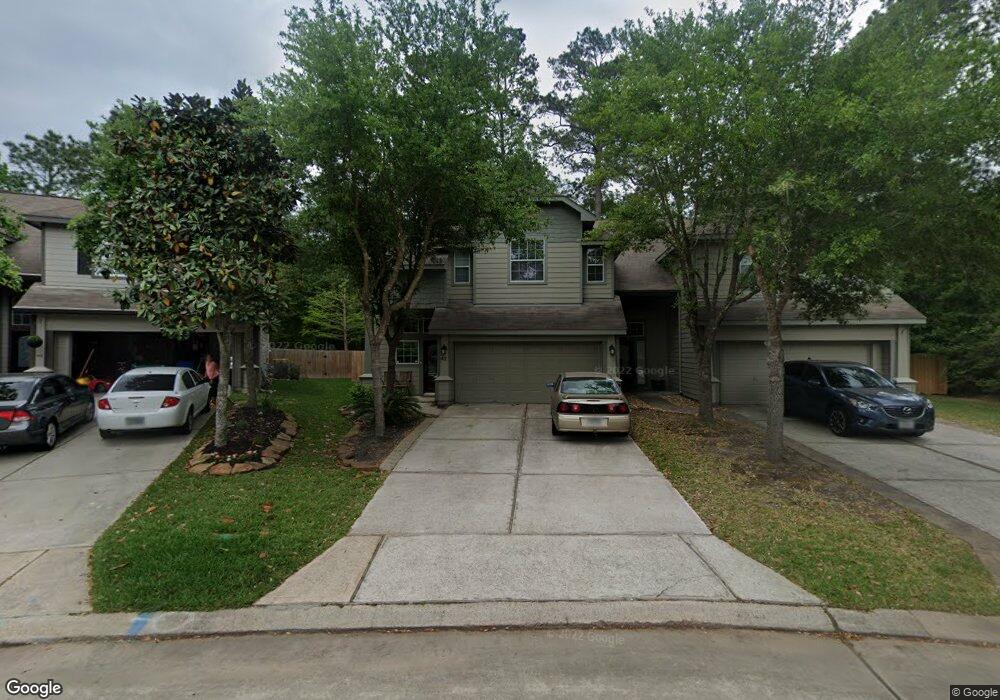
42 W Twinvale Loop Conroe, TX 77384
Alden Bridge NeighborhoodEstimated Value: $308,706 - $347,000
3
Beds
3
Baths
2,124
Sq Ft
$154/Sq Ft
Est. Value
About This Home
This home is located at 42 W Twinvale Loop, Conroe, TX 77384 and is currently estimated at $327,677, approximately $154 per square foot. 42 W Twinvale Loop is a home located in Montgomery County with nearby schools including David Elementary School, Collins Intermediate School, and Knox J High School.
Ownership History
Date
Name
Owned For
Owner Type
Purchase Details
Closed on
Mar 13, 2019
Sold by
Russell Kyle D and Gallia Anna Rose
Bought by
Jeske Manfred and Jeske Crystal Nichole
Current Estimated Value
Home Financials for this Owner
Home Financials are based on the most recent Mortgage that was taken out on this home.
Original Mortgage
$195,700
Interest Rate
4%
Mortgage Type
New Conventional
Purchase Details
Closed on
Nov 19, 2012
Sold by
Noel Renee April
Bought by
Russell Kyle D and Gallia Anna R
Home Financials for this Owner
Home Financials are based on the most recent Mortgage that was taken out on this home.
Original Mortgage
$96,000
Interest Rate
3.43%
Mortgage Type
New Conventional
Purchase Details
Closed on
May 19, 2006
Sold by
Lennar Homes Of Texas
Bought by
Noel Renee April
Home Financials for this Owner
Home Financials are based on the most recent Mortgage that was taken out on this home.
Original Mortgage
$147,276
Interest Rate
6.5%
Mortgage Type
FHA
Create a Home Valuation Report for This Property
The Home Valuation Report is an in-depth analysis detailing your home's value as well as a comparison with similar homes in the area
Home Values in the Area
Average Home Value in this Area
Purchase History
| Date | Buyer | Sale Price | Title Company |
|---|---|---|---|
| Jeske Manfred | -- | Providence Title Company | |
| Russell Kyle D | -- | Chicago Title | |
| Noel Renee April | -- | North American Title Co | |
| Lennar Homes Of Texas Sales & Mktg Ltd | -- | North American Title Co |
Source: Public Records
Mortgage History
| Date | Status | Borrower | Loan Amount |
|---|---|---|---|
| Previous Owner | Jeske Manfred | $195,700 | |
| Previous Owner | Russell Kyle D | $96,000 | |
| Previous Owner | Noel Renee April | $147,276 |
Source: Public Records
Tax History
| Year | Tax Paid | Tax Assessment Tax Assessment Total Assessment is a certain percentage of the fair market value that is determined by local assessors to be the total taxable value of land and additions on the property. | Land | Improvement |
|---|---|---|---|---|
| 2025 | $4,071 | $330,717 | -- | -- |
| 2024 | $3,631 | $300,652 | -- | -- |
| 2023 | $3,631 | $273,320 | $40,000 | $277,650 |
| 2022 | $4,928 | $248,470 | $40,000 | $258,470 |
| 2021 | $4,804 | $225,880 | $25,660 | $200,220 |
| 2020 | $4,868 | $218,460 | $25,660 | $192,800 |
| 2019 | $4,949 | $215,020 | $25,660 | $189,360 |
| 2018 | $4,282 | $212,890 | $25,660 | $187,230 |
| 2017 | $5,170 | $212,890 | $25,660 | $187,230 |
| 2016 | $4,984 | $205,230 | $25,660 | $197,100 |
| 2015 | $3,987 | $186,570 | $25,660 | $172,460 |
| 2014 | $3,987 | $169,610 | $25,660 | $159,700 |
Source: Public Records
Map
Nearby Homes
- 226 W Stedhill Loop
- 106 E Stedhill Loop
- 46 E Stedhill Loop
- 157 E Summerhaze Cir
- 27 Summer Haze Cir
- 71 Summerhaze Cir
- 23 N Morning Cloud Cir
- 78 E Evangeline Oaks Cir
- 23 E Summer Storm Cir
- 79 Anise Tree Place
- 38 Wineberry Place
- 51 Wineberry Place
- 2 Westward Ridge Place
- 82 E Coldbrook Cir
- 14 Valley Oaks Cir
- 34 Sweetdream Place
- 191 Golden Autumn Place
- 34 Cypress Bayou Ct
- 59 N Avonlea Cir
- 60 W Twinberry Place
- 46 W Twinvale Loop
- 38 W Twinvale Loop
- 50 W Twinvale Loop
- 54 W Twinvale Loop
- 58 W Twinvale Loop
- 39 E Twinvale Loop
- 35 E Twinvale Loop
- 62 W Twinvale Loop
- 31 E Twinvale Loop
- 66 W Twinvale Loop
- 79 W Twinvale Loop
- 27 E Twinvale Loop
- 178 W Stedhill Loop
- 83 W Twinvale Loop
- 182 W Stedhill Loop
- 70 W Twinvale Loop
- 186 W Stedhill Loop
- 23 E Twinvale Loop
- 174 W Stedhill Loop
- 87 W Twinvale Loop
Your Personal Tour Guide
Ask me questions while you tour the home.