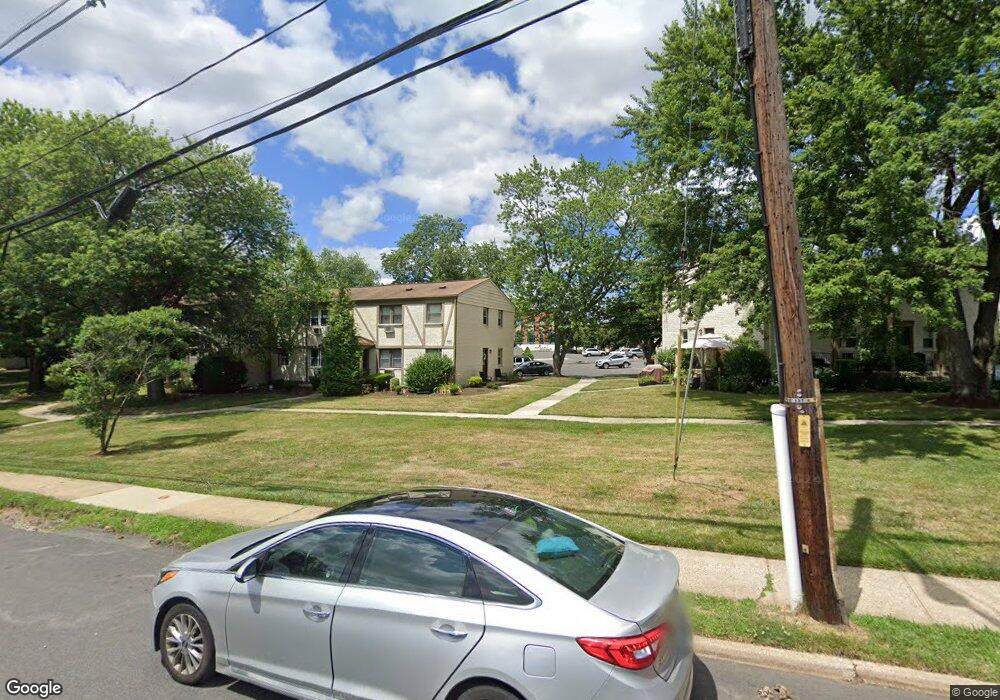
420 Cross Rd Unit B7 Matawan, NJ 07747
Estimated Value: $239,000 - $266,882
2
Beds
1
Bath
850
Sq Ft
$295/Sq Ft
Est. Value
About This Home
This home is located at 420 Cross Rd Unit B7, Matawan, NJ 07747 and is currently estimated at $250,971, approximately $295 per square foot. 420 Cross Rd Unit B7 is a home located in Monmouth County with nearby schools including Matawan Reg High School, Matawan Montessori Academy, and Icob Academy.
Ownership History
Date
Name
Owned For
Owner Type
Purchase Details
Closed on
Jan 28, 2025
Sold by
Oleynik Daniil and Parobchak Maryana
Bought by
Oleynik Daniil
Current Estimated Value
Purchase Details
Closed on
Mar 21, 2017
Sold by
Giordano David and Giordano Joann
Bought by
Oleynik Daniil and Parobchak Maryana
Home Financials for this Owner
Home Financials are based on the most recent Mortgage that was taken out on this home.
Original Mortgage
$113,850
Interest Rate
4.15%
Mortgage Type
New Conventional
Purchase Details
Closed on
Jun 16, 2015
Sold by
Stanco Felix A
Bought by
Giordano David and Giordano Joann
Purchase Details
Closed on
Aug 1, 2013
Sold by
Kim Stanco Natalia V
Bought by
Stanco Felix
Purchase Details
Closed on
Jan 23, 1998
Sold by
Jankauskas Mary
Bought by
Stanco Felix
Purchase Details
Closed on
Nov 20, 1995
Sold by
Markowitz Mary
Bought by
Jankauskas Mary
Create a Home Valuation Report for This Property
The Home Valuation Report is an in-depth analysis detailing your home's value as well as a comparison with similar homes in the area
Home Values in the Area
Average Home Value in this Area
Purchase History
| Date | Buyer | Sale Price | Title Company |
|---|---|---|---|
| Oleynik Daniil | -- | None Listed On Document | |
| Oleynik Daniil | -- | None Listed On Document | |
| Oleynik Daniil | $126,500 | None Available | |
| Giordano David | $67,000 | Acres Land Title Agency Llc | |
| Stanco Felix | -- | None Available | |
| Stanco Felix | $25,000 | -- | |
| Jankauskas Mary | $50,000 | -- |
Source: Public Records
Mortgage History
| Date | Status | Borrower | Loan Amount |
|---|---|---|---|
| Previous Owner | Oleynik Daniil | $113,850 |
Source: Public Records
Tax History Compared to Growth
Tax History
| Year | Tax Paid | Tax Assessment Tax Assessment Total Assessment is a certain percentage of the fair market value that is determined by local assessors to be the total taxable value of land and additions on the property. | Land | Improvement |
|---|---|---|---|---|
| 2025 | $4,327 | $226,900 | $101,400 | $125,500 |
| 2024 | $4,233 | $198,200 | $98,400 | $99,800 |
| 2023 | $4,233 | $194,700 | $95,900 | $98,800 |
| 2022 | $4,040 | $170,000 | $75,900 | $94,100 |
| 2021 | $2,859 | $148,700 | $63,000 | $85,700 |
| 2020 | $3,357 | $122,700 | $38,000 | $84,700 |
| 2019 | $2,828 | $103,600 | $21,000 | $82,600 |
| 2018 | $2,819 | $101,600 | $20,000 | $81,600 |
| 2017 | $2,463 | $87,500 | $7,500 | $80,000 |
| 2016 | $2,450 | $88,900 | $10,000 | $78,900 |
| 2015 | $2,415 | $88,300 | $12,500 | $75,800 |
| 2014 | $2,818 | $103,400 | $25,000 | $78,400 |
Source: Public Records
Map
Nearby Homes
- 202 Ravine Dr
- 70 County Rd
- 89 Arlington Ave
- 21 Briarwood Dr
- 82 Cliffwood Ave Unit 53
- 82 Cliffwood Ave Unit C17
- 23 Briarwood Dr
- 60 Biondi Ave
- 36 Union St
- 97D Aberdeen Rd
- 165 Cliffwood Ave
- 14 Wayland Dr
- 97E Aberdeen Rd
- 183 Cliffwood Ave
- 193 Cliffwood Ave
- 29 Athens Way
- 190 Delaware Ave
- 2 Monmouth Ct
- 7 Georgia Ct Unit D
- 207 Delaware Ave
- 420 Cross Rd Unit B3
- 420 Cross Rd Unit B6
- 420 Cross Rd Unit B12
- 420 Cross Rd Unit B2
- 420 Cross Rd Unit B14
- 420 Cross Rd Unit B11
- 420 Cross Rd Unit B5
- 420 Cross Rd Unit B8
- 420 Cross Rd Unit B4
- 420 Cross Rd Unit B10
- 420 Cross Rd Unit B13
- 420 Cross Rd Unit C1
- 420 Cross Rd Unit B15
- 420 Cross Rd Unit B3
- 420 Cross Rd Unit B1
- 520 Cliffwood Ave
- 0 Cliffwood Ave
- 520 Cliffwood Ave Unit 15
- 520 Cliffwood Ave Unit 6
- 520 Cliffwood Ave Unit E-1