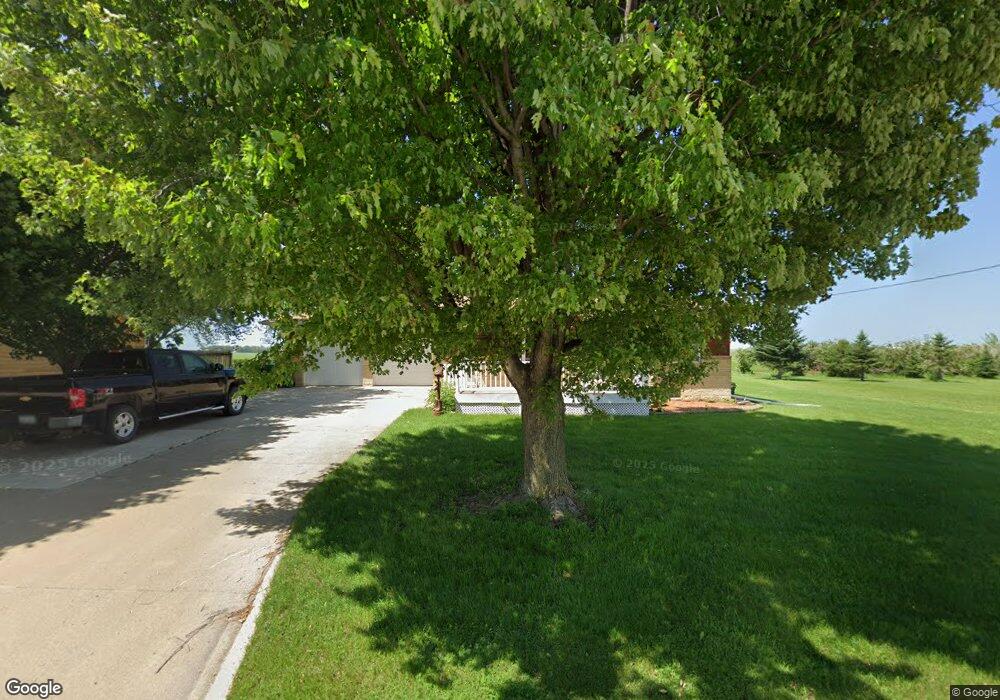
420 E 6th St Kanawha, IA 50447
Estimated Value: $163,000 - $191,000
3
Beds
2
Baths
1,352
Sq Ft
$128/Sq Ft
Est. Value
About This Home
This home is located at 420 E 6th St, Kanawha, IA 50447 and is currently estimated at $173,618, approximately $128 per square foot. 420 E 6th St is a home located in Hancock County with nearby schools including West Hancock Elementary School, West Hancock Middle School, and West Hancock High School.
Ownership History
Date
Name
Owned For
Owner Type
Purchase Details
Closed on
Oct 28, 2024
Sold by
Eekhoff Andrew and Eekhoff Amanda
Bought by
Kuester Ross and Kuester Emili
Current Estimated Value
Home Financials for this Owner
Home Financials are based on the most recent Mortgage that was taken out on this home.
Original Mortgage
$163,440
Outstanding Balance
$161,672
Interest Rate
6.2%
Mortgage Type
VA
Estimated Equity
$11,946
Purchase Details
Closed on
Apr 23, 2021
Sold by
Ruter Glen A and Ruter Carolyn J
Bought by
Eekhoff Andrew and Eekhoff Amanda
Create a Home Valuation Report for This Property
The Home Valuation Report is an in-depth analysis detailing your home's value as well as a comparison with similar homes in the area
Home Values in the Area
Average Home Value in this Area
Purchase History
| Date | Buyer | Sale Price | Title Company |
|---|---|---|---|
| Kuester Ross | $160,000 | None Listed On Document | |
| Eekhoff Andrew | $125,000 | None Listed On Document |
Source: Public Records
Mortgage History
| Date | Status | Borrower | Loan Amount |
|---|---|---|---|
| Open | Kuester Ross | $163,440 |
Source: Public Records
Tax History Compared to Growth
Tax History
| Year | Tax Paid | Tax Assessment Tax Assessment Total Assessment is a certain percentage of the fair market value that is determined by local assessors to be the total taxable value of land and additions on the property. | Land | Improvement |
|---|---|---|---|---|
| 2025 | $2,334 | $169,090 | $20,140 | $148,950 |
| 2024 | $2,334 | $146,020 | $12,590 | $133,430 |
| 2023 | $2,298 | $146,020 | $12,590 | $133,430 |
| 2022 | $1,768 | $126,120 | $12,590 | $113,530 |
| 2021 | $1,532 | $88,050 | $12,590 | $75,460 |
| 2020 | $1,532 | $87,920 | $12,590 | $75,330 |
| 2019 | $1,542 | $87,920 | $12,590 | $75,330 |
| 2018 | $1,556 | $81,150 | $12,590 | $68,560 |
| 2017 | $1,284 | $68,000 | $0 | $0 |
| 2016 | $1,202 | $68,000 | $0 | $0 |
| 2015 | $1,202 | $66,610 | $0 | $0 |
| 2014 | $1,120 | $66,610 | $0 | $0 |
Source: Public Records
Map
Nearby Homes