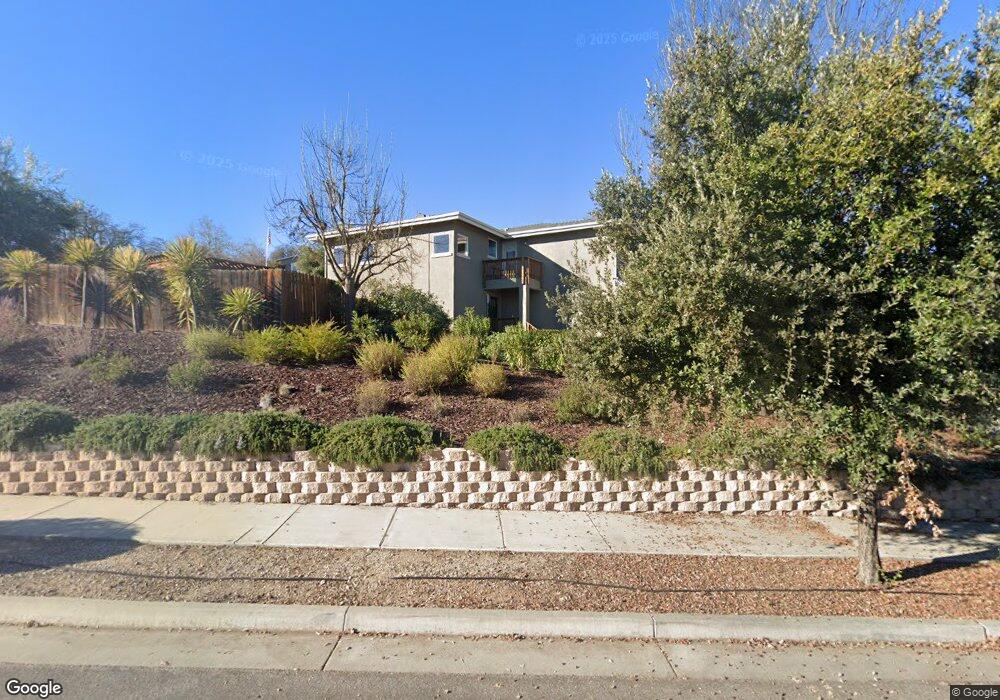
420 Montebello Oaks Dr Unit Lt 20 Paso Robles, CA 93446
Estimated Value: $893,080 - $957,000
3
Beds
3
Baths
1,796
Sq Ft
$513/Sq Ft
Est. Value
About This Home
This home is located at 420 Montebello Oaks Dr Unit Lt 20, Paso Robles, CA 93446 and is currently estimated at $921,770, approximately $513 per square foot. 420 Montebello Oaks Dr Unit Lt 20 is a home located in San Luis Obispo County with nearby schools including Glen Speck Elementary School, Daniel Lewis Middle School, and Paso Robles High School.
Ownership History
Date
Name
Owned For
Owner Type
Purchase Details
Closed on
Aug 26, 2024
Sold by
Menacho Family Trust and Menacho Frank
Bought by
Davis Anna Christine and Davis Ross Brian
Current Estimated Value
Home Financials for this Owner
Home Financials are based on the most recent Mortgage that was taken out on this home.
Original Mortgage
$881,734
Outstanding Balance
$872,373
Interest Rate
6.77%
Mortgage Type
FHA
Estimated Equity
$49,397
Purchase Details
Closed on
Mar 31, 2021
Sold by
Menacho Frank M and Menacho Martha P
Bought by
Menacho Frank and Menacho Martha P
Purchase Details
Closed on
Jan 3, 2006
Sold by
Doya Partners Llc
Bought by
Menacho Frank M and Menacho Martha P
Home Financials for this Owner
Home Financials are based on the most recent Mortgage that was taken out on this home.
Original Mortgage
$305,000
Interest Rate
6.41%
Mortgage Type
Fannie Mae Freddie Mac
Create a Home Valuation Report for This Property
The Home Valuation Report is an in-depth analysis detailing your home's value as well as a comparison with similar homes in the area
Home Values in the Area
Average Home Value in this Area
Purchase History
| Date | Buyer | Sale Price | Title Company |
|---|---|---|---|
| Davis Anna Christine | $898,000 | Placer Title | |
| Menacho Frank | -- | None Available | |
| Menacho Frank M | $551,000 | Cuesta Title |
Source: Public Records
Mortgage History
| Date | Status | Borrower | Loan Amount |
|---|---|---|---|
| Open | Davis Anna Christine | $881,734 | |
| Previous Owner | Menacho Frank M | $305,000 |
Source: Public Records
Tax History Compared to Growth
Tax History
| Year | Tax Paid | Tax Assessment Tax Assessment Total Assessment is a certain percentage of the fair market value that is determined by local assessors to be the total taxable value of land and additions on the property. | Land | Improvement |
|---|---|---|---|---|
| 2025 | $8,593 | $898,000 | $325,000 | $573,000 |
| 2024 | $8,440 | $738,073 | $368,434 | $369,639 |
| 2023 | $8,440 | $723,602 | $361,210 | $362,392 |
| 2022 | $8,316 | $709,415 | $354,128 | $355,287 |
| 2021 | $6,916 | $583,000 | $290,000 | $293,000 |
| 2020 | $6,509 | $550,000 | $275,000 | $275,000 |
| 2019 | $6,194 | $520,000 | $250,000 | $270,000 |
| 2018 | $6,230 | $520,000 | $250,000 | $270,000 |
| 2017 | $5,514 | $469,000 | $235,000 | $234,000 |
| 2016 | $5,188 | $439,000 | $220,000 | $219,000 |
| 2015 | $4,740 | $415,000 | $205,000 | $210,000 |
| 2014 | $4,503 | $400,000 | $205,000 | $195,000 |
Source: Public Records
Map
Nearby Homes
- 430 Montebello Oaks Dr
- 1766 Union Rd
- 2050 Prospect Ave
- 925 Osos Way
- 2450 Golden Hill Rd
- 0 Ardmore Rd Unit NS24094144
- 0 Ardmore Rd Unit NS24094132
- 0 Ardmore Rd Unit NS24094137
- 0 Ardmore Rd Unit NS24094126
- 1226 Kapareil Ln
- 959 Vista Cerro Dr
- 833 Rolling Hills Rd Unit 16
- 616 Jackson Dr
- 0 Orchard Dr
- 3405 Golden Hill Rd
- 912 Salida Del Sol Dr
- 726 N Trigo Ln
- 0 Engine Ave
- 821 Marlbank Place
- 715 Orchard Dr
- 420 Montebello Oaks Dr
- 421 Montebello Oaks Dr Unit 29
- 423 Montebello Oaks Dr Unit 28
- 423 Montebello Oaks Dr
- 425 Montebello Oaks Dr Unit 27
- 1646 Kleck Rd
- 416 Montebello Oaks Dr Unit Lt 19
- 416 Montebello Oaks Dr
- 427 Montebello Oaks Dr Unit 26
- 427 Montebello Oaks Dr
- 428 Montebello Oaks Dr
- 414 Montebello Oaks Dr Unit 18
- 414 Montebello Oaks Dr
- 1803 Arciero Way
- 417 Montebello Oaks Dr
- 429 Montebello Oaks Dr Unit Lt 25
- 429 Montebello Oaks Dr
- 1753 Arciero Way Unit 31
- 1753 Arciero Way