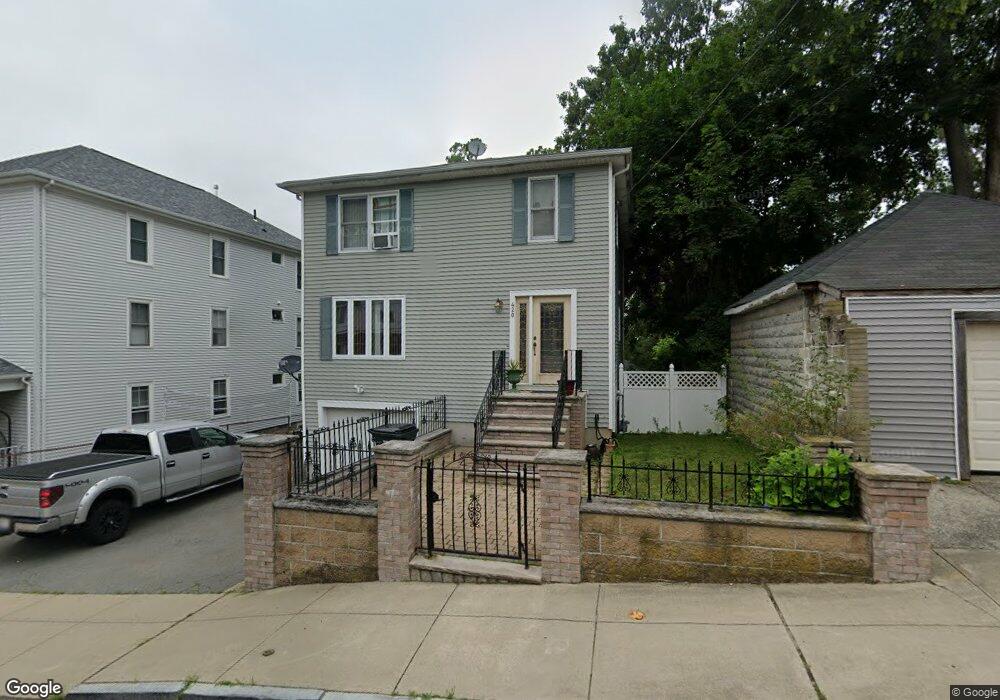
420 Pearce St Fall River, MA 02720
Lower Highlands NeighborhoodEstimated Value: $352,000 - $475,000
3
Beds
2
Baths
1,560
Sq Ft
$258/Sq Ft
Est. Value
About This Home
This home is located at 420 Pearce St, Fall River, MA 02720 and is currently estimated at $402,667, approximately $258 per square foot. 420 Pearce St is a home located in Bristol County with nearby schools including Spencer Borden Elementary School, Morton Middle School, and B M C Durfee High School.
Ownership History
Date
Name
Owned For
Owner Type
Purchase Details
Closed on
Aug 11, 2000
Sold by
Kenneth L Sullivan Nt
Bought by
Charest Paul R and Charest Judith A
Current Estimated Value
Purchase Details
Closed on
Dec 16, 1998
Sold by
Sousa Maria and Sousa Mary
Bought by
Ferreira Maureen V and Dillon Jamie
Purchase Details
Closed on
May 15, 1998
Sold by
Oliveira George and Oliveira Mary A
Bought by
Azuos Rt
Purchase Details
Closed on
Jan 10, 1997
Sold by
Karam Albert and Karam Elie
Bought by
Moniz Al
Purchase Details
Closed on
Jun 21, 1994
Sold by
Ayres Gerald R
Bought by
Karam Albert and Karam Elie
Purchase Details
Closed on
Dec 16, 1987
Sold by
Commonwealth-Mass
Bought by
Azar Fred H
Purchase Details
Closed on
Aug 10, 1987
Sold by
Frederi Ks Noella
Bought by
Ayres Gerald R
Create a Home Valuation Report for This Property
The Home Valuation Report is an in-depth analysis detailing your home's value as well as a comparison with similar homes in the area
Home Values in the Area
Average Home Value in this Area
Purchase History
| Date | Buyer | Sale Price | Title Company |
|---|---|---|---|
| Charest Paul R | $67,000 | -- | |
| Ferreira Maureen V | $132,000 | -- | |
| Azuos Rt | $155,000 | -- | |
| Moniz Al | $117,000 | -- | |
| Karam Albert | $26,000 | -- | |
| Azar Fred H | $121,000 | -- | |
| Ayres Gerald R | $3,900 | -- |
Source: Public Records
Mortgage History
| Date | Status | Borrower | Loan Amount |
|---|---|---|---|
| Open | Ayres Gerald R | $25,000 | |
| Open | Ayres Gerald R | $146,500 |
Source: Public Records
Tax History
| Year | Tax Paid | Tax Assessment Tax Assessment Total Assessment is a certain percentage of the fair market value that is determined by local assessors to be the total taxable value of land and additions on the property. | Land | Improvement |
|---|---|---|---|---|
| 2025 | $3,640 | $317,900 | $115,800 | $202,100 |
| 2024 | $3,437 | $299,100 | $113,500 | $185,600 |
| 2023 | $3,551 | $289,400 | $102,300 | $187,100 |
| 2022 | $3,179 | $251,900 | $96,500 | $155,400 |
| 2021 | $3,138 | $226,900 | $92,200 | $134,700 |
| 2020 | $3,094 | $214,100 | $88,000 | $126,100 |
| 2019 | $3,103 | $212,800 | $92,000 | $120,800 |
| 2018 | $2,990 | $204,500 | $90,500 | $114,000 |
| 2017 | $2,835 | $202,500 | $90,500 | $112,000 |
| 2016 | $2,734 | $200,600 | $95,300 | $105,300 |
| 2015 | $2,660 | $203,400 | $95,300 | $108,100 |
| 2014 | $2,559 | $203,400 | $95,300 | $108,100 |
Source: Public Records
Map
Nearby Homes
- 909 High St Unit 1
- 889 High St
- 267 Lincoln Ave
- 327 Brownell St
- 33-35 Malvey St
- 503 Highland Ave
- 11 Dyer St
- 72 Belmont St
- 376 N Underwood St
- 10 N Court St Unit 3
- 499 Hanover St
- 302 Cory St
- 213 Weetamoe St
- 301 Madison St
- 102 Vestal St
- 131 Stewart St Unit 2
- 131 Stewart St Unit 3A
- 65 Bigelow St
- 575 N Main St
- 750 Davol St Unit 1012
- 404 Pearce St
- 366 Belmont St
- 380 Belmont St
- 35 Mcclure Place
- 368 Belmont St Unit 3
- 413 Pearce St
- 413 Pearce St Unit 1
- 413 Pearce St Unit 2
- 949 High St
- 961-963 High St
- 400 Belmont St
- 971 High St
- 961 High St
- 961 High St Unit 2
- 425 Pearce St
- 342 Belmont St
- 979 High St
- 933 High St
- 405 Pearce St
- 36 Mcclure Place
Your Personal Tour Guide
Ask me questions while you tour the home.