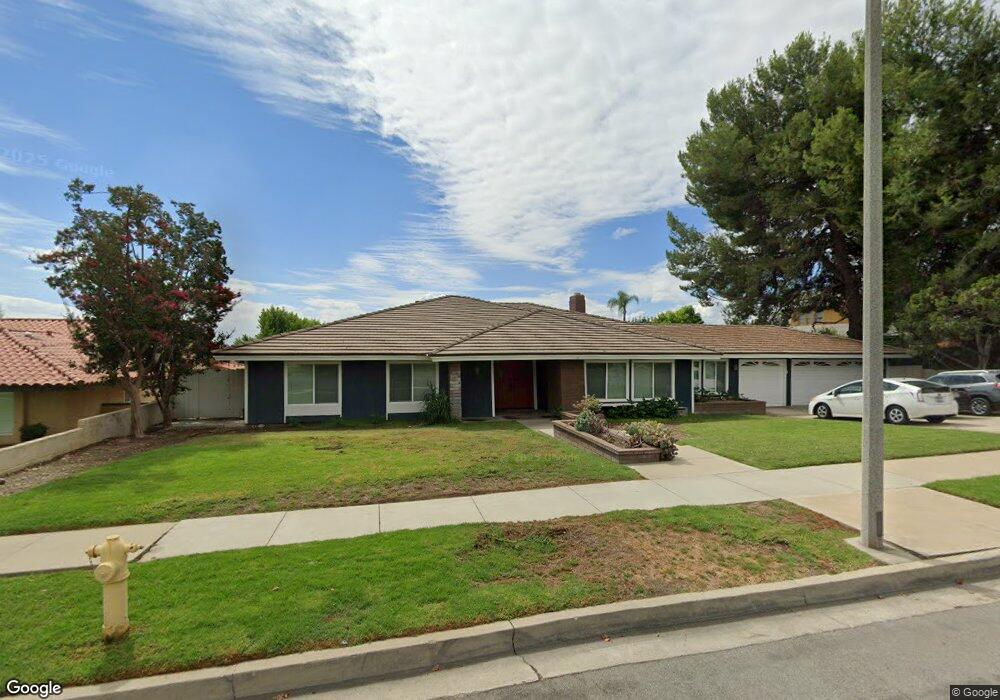
420 W 18th St Upland, CA 91784
Estimated Value: $1,297,000 - $1,420,000
5
Beds
3
Baths
3,507
Sq Ft
$388/Sq Ft
Est. Value
About This Home
This home is located at 420 W 18th St, Upland, CA 91784 and is currently estimated at $1,360,237, approximately $387 per square foot. 420 W 18th St is a home located in San Bernardino County with nearby schools including Magnolia Elementary, Pioneer Junior High School, and Upland High School.
Ownership History
Date
Name
Owned For
Owner Type
Purchase Details
Closed on
Apr 17, 2008
Sold by
Tang Jane
Bought by
Tang Jane
Current Estimated Value
Home Financials for this Owner
Home Financials are based on the most recent Mortgage that was taken out on this home.
Original Mortgage
$400,000
Outstanding Balance
$255,228
Interest Rate
6.11%
Mortgage Type
New Conventional
Estimated Equity
$1,105,009
Purchase Details
Closed on
Feb 26, 2007
Sold by
Tang Jonathan
Bought by
Tang Jane
Purchase Details
Closed on
Jul 8, 2000
Sold by
Huynh Ky Trinh Le
Bought by
Tang Jonathan and Tang Jane
Create a Home Valuation Report for This Property
The Home Valuation Report is an in-depth analysis detailing your home's value as well as a comparison with similar homes in the area
Home Values in the Area
Average Home Value in this Area
Purchase History
We collect this data history from publicly available records. To have your information removed, we recommend requesting removal directly through your county’s website.
| Date | Buyer | Sale Price | Title Company |
|---|---|---|---|
| Tang Jane | -- | Southland Title Corporation | |
| Tang Jane | -- | None Available | |
| Tang Jonathan | -- | -- |
Source: Public Records
Mortgage History
We collect this data history from publicly available records. To have your information removed, we recommend requesting removal directly through your county’s website.
| Date | Status | Borrower | Loan Amount |
|---|---|---|---|
| Open | Tang Jane | $400,000 |
Source: Public Records
Tax History
| Year | Tax Paid | Tax Assessment Tax Assessment Total Assessment is a certain percentage of the fair market value that is determined by local assessors to be the total taxable value of land and additions on the property. | Land | Improvement |
|---|---|---|---|---|
| 2025 | $7,239 | $662,354 | $220,786 | $441,568 |
| 2024 | $7,008 | $649,367 | $216,457 | $432,910 |
| 2023 | $6,902 | $636,635 | $212,213 | $424,422 |
| 2022 | $6,753 | $624,152 | $208,052 | $416,100 |
| 2021 | $6,745 | $611,914 | $203,973 | $407,941 |
| 2020 | $6,561 | $605,640 | $201,882 | $403,758 |
| 2019 | $6,537 | $593,765 | $197,924 | $395,841 |
| 2018 | $6,376 | $582,122 | $194,043 | $388,079 |
| 2017 | $6,191 | $570,708 | $190,238 | $380,470 |
| 2016 | $5,957 | $559,518 | $186,508 | $373,010 |
| 2015 | $5,821 | $551,113 | $183,706 | $367,407 |
| 2014 | $5,670 | $540,317 | $180,107 | $360,210 |
Source: Public Records
Map
Nearby Homes
- 1831 N Redding Way
- 1696 N Redding Way
- 1695 N Palm Ave
- 252 W 19th St
- 276 Grant St
- 1669 N San Antonio Ave
- 928 W Buffington St
- 1623 N Vallejo Way
- 1560 Carnation Way
- 2015 N Palm Ave
- 888 Via Maria
- 1685 Francis Ave
- 1031 W Patrick St
- 959 Kenwood St
- 1942 N 3rd Ave
- 2040 N Albright Ave
- 904 Pineridge St
- 2074 N Albright Ave
- 1528 N 1st Ave
- 2009 N Shorewood Ave
- 450 W 18th St
- 380 W 18th St
- 419 W Clark St
- 453 W Clark St
- 381 W Clark St
- 1804 N Redding Way
- 480 W 18th St
- 481 W Clark St
- 336 W 18th St
- 1803 N Redding Way
- 1810 N Redding Way
- 337 W Clark St
- 526 W 18th St
- 1811 N Redding Way Unit H
- 1811 N Redding Way
- 428 W Clark St
- 1818 N Redding Way
- 527 W Clark St
- 450 W Clark St
- 390 W Clark St
Your Personal Tour Guide
Ask me questions while you tour the home.