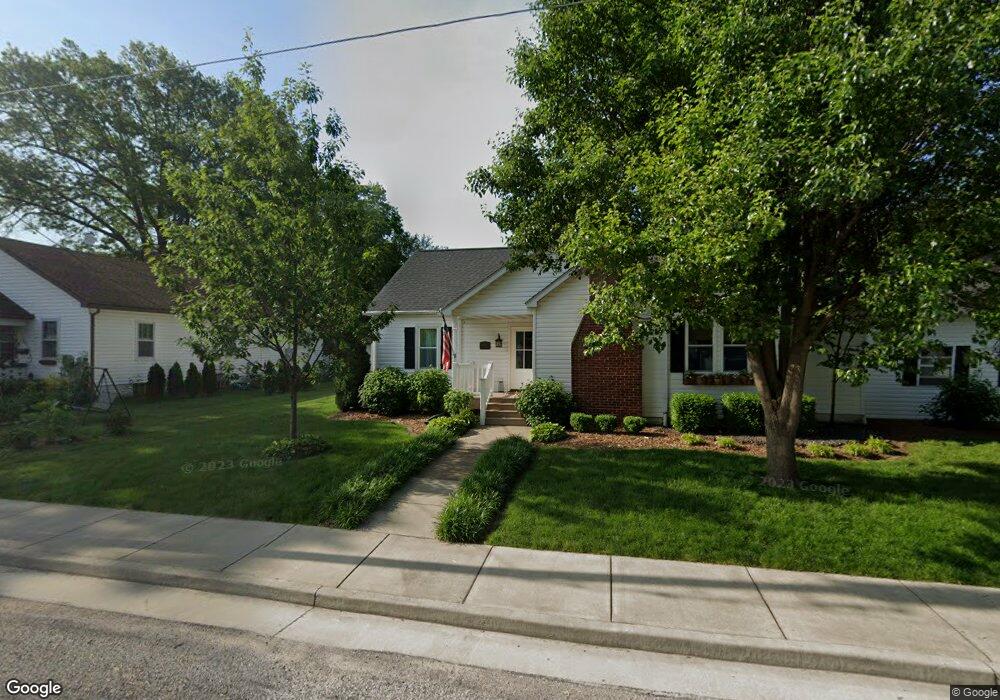
420 W Laurel St Millstadt, IL 62260
Estimated Value: $221,000 - $340,000
4
Beds
2
Baths
2,373
Sq Ft
$117/Sq Ft
Est. Value
About This Home
This home is located at 420 W Laurel St, Millstadt, IL 62260 and is currently estimated at $278,071, approximately $117 per square foot. 420 W Laurel St is a home located in St. Clair County with nearby schools including Millstadt Consolidated School, Millstadt Primary Center, and St James Catholic School.
Ownership History
Date
Name
Owned For
Owner Type
Purchase Details
Closed on
Aug 31, 2009
Sold by
Hoepfinger Bonnie J
Bought by
Hampton Ron A and Hampton Tara M
Current Estimated Value
Home Financials for this Owner
Home Financials are based on the most recent Mortgage that was taken out on this home.
Original Mortgage
$159,065
Outstanding Balance
$104,502
Interest Rate
5.28%
Mortgage Type
FHA
Estimated Equity
$173,569
Purchase Details
Closed on
Feb 12, 2009
Sold by
Hoepfinger David N
Bought by
Hoepfinger Bonnie J
Purchase Details
Closed on
Jul 3, 2001
Sold by
Hoock Frances N and Marks Sherry A
Bought by
Hoepfinger David N and Hoepfinger Bonnie J
Home Financials for this Owner
Home Financials are based on the most recent Mortgage that was taken out on this home.
Original Mortgage
$109,000
Interest Rate
7.2%
Create a Home Valuation Report for This Property
The Home Valuation Report is an in-depth analysis detailing your home's value as well as a comparison with similar homes in the area
Home Values in the Area
Average Home Value in this Area
Purchase History
| Date | Buyer | Sale Price | Title Company |
|---|---|---|---|
| Hampton Ron A | $162,000 | Columbia Title | |
| Hoepfinger Bonnie J | -- | None Available | |
| Hoepfinger David N | $153,000 | Chicago Title |
Source: Public Records
Mortgage History
| Date | Status | Borrower | Loan Amount |
|---|---|---|---|
| Open | Hampton Ron A | $159,065 | |
| Previous Owner | Hoepfinger David N | $109,000 |
Source: Public Records
Tax History Compared to Growth
Tax History
| Year | Tax Paid | Tax Assessment Tax Assessment Total Assessment is a certain percentage of the fair market value that is determined by local assessors to be the total taxable value of land and additions on the property. | Land | Improvement |
|---|---|---|---|---|
| 2024 | $6,883 | $100,758 | $13,532 | $87,226 |
| 2023 | $6,505 | $91,582 | $12,300 | $79,282 |
| 2022 | $6,152 | $83,431 | $11,205 | $72,226 |
| 2021 | $5,890 | $77,144 | $10,361 | $66,783 |
| 2020 | $5,064 | $63,972 | $9,076 | $54,896 |
| 2019 | $4,884 | $63,972 | $9,076 | $54,896 |
| 2018 | $5,402 | $70,096 | $8,749 | $61,347 |
| 2017 | $4,955 | $69,148 | $8,631 | $60,517 |
| 2016 | $4,482 | $57,292 | $9,113 | $48,179 |
| 2014 | $3,828 | $55,041 | $8,755 | $46,286 |
| 2013 | $3,148 | $52,480 | $8,348 | $44,132 |
Source: Public Records
Map
Nearby Homes
- 603 W White St
- 423 W Washington St
- 13 N Jackson St
- 802 S Jackson St
- 29 Cedar St
- 112 N Breese St
- 109 E Mill St
- 202 E Mill St
- 109 E Gooding St
- 300 S Kossuth St
- 403 E Washington St
- 339 E Mill St
- 709 Admiral Wendt Pkwy
- 87 Regency Place
- 3295 Veranda Ct
- 130 Regency Place
- 19 Adderly Ln
- 4 Liederkranz Ln
- 113 Adderly Ln
- 125 Gladwyn Dr
- 414 W Laurel St
- 419 W Oak St
- 504 W Laurel St
- 415 W Oak St
- 410 W Laurel St
- 423 W Laurel St
- 411 W Oak St
- 413 W Laurel St
- 512 W Laurel St
- 511 W Oak St
- 503 W Laurel St
- 507 W Laurel St
- 409 W Laurel St
- 420 W Oak St
- 401 W Oak St
- 500 W Oak St
- 500 W Oak St
- 217 S Lafayette St
- 511 W Laurel St
- 217 S Lafayette St