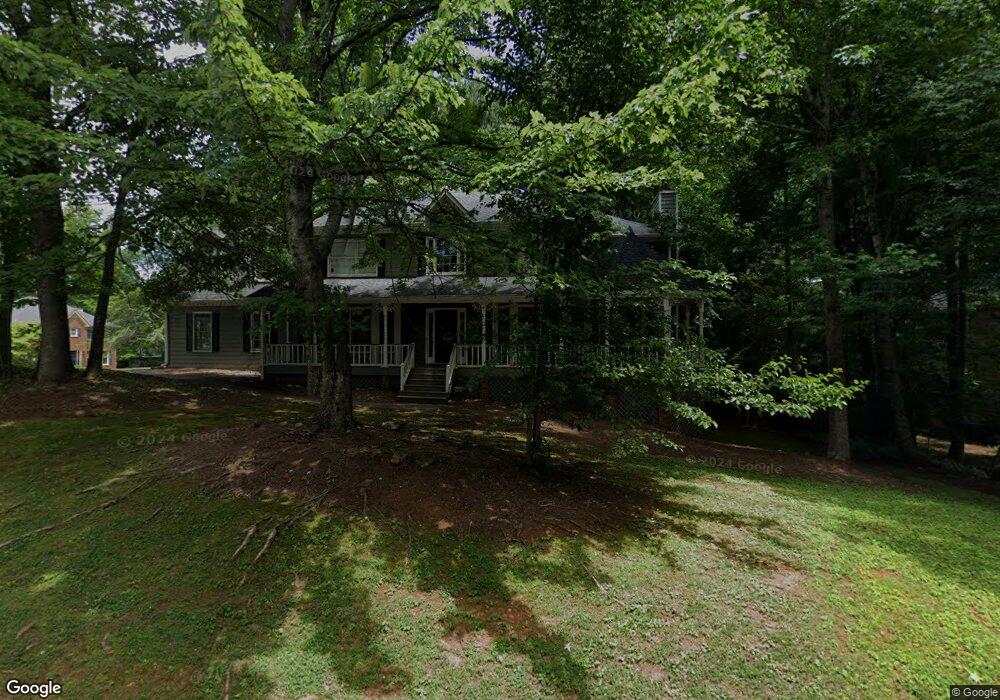
4200 Arbor Spring Dr Marietta, GA 30066
Sandy Plains NeighborhoodEstimated Value: $615,229 - $731,000
4
Beds
3
Baths
2,643
Sq Ft
$250/Sq Ft
Est. Value
About This Home
This home is located at 4200 Arbor Spring Dr, Marietta, GA 30066 and is currently estimated at $661,807, approximately $250 per square foot. 4200 Arbor Spring Dr is a home located in Cobb County with nearby schools including Rocky Mount Elementary School, Mabry Middle School, and Lassiter High School.
Ownership History
Date
Name
Owned For
Owner Type
Purchase Details
Closed on
Jun 28, 2010
Sold by
Clark Peter F
Bought by
Clark Peter F and Clark Casey A
Current Estimated Value
Home Financials for this Owner
Home Financials are based on the most recent Mortgage that was taken out on this home.
Original Mortgage
$263,945
Outstanding Balance
$174,976
Interest Rate
4.75%
Mortgage Type
FHA
Estimated Equity
$486,831
Purchase Details
Closed on
Jan 26, 2001
Sold by
Arena Brennan Dorothy C
Bought by
Brennan Terrence J
Home Financials for this Owner
Home Financials are based on the most recent Mortgage that was taken out on this home.
Original Mortgage
$184,000
Interest Rate
7.18%
Mortgage Type
New Conventional
Create a Home Valuation Report for This Property
The Home Valuation Report is an in-depth analysis detailing your home's value as well as a comparison with similar homes in the area
Home Values in the Area
Average Home Value in this Area
Purchase History
| Date | Buyer | Sale Price | Title Company |
|---|---|---|---|
| Clark Peter F | $267,500 | -- | |
| Clark Peter F | $267,500 | -- | |
| Brennan Terrence J | -- | -- |
Source: Public Records
Mortgage History
| Date | Status | Borrower | Loan Amount |
|---|---|---|---|
| Open | Clark Peter F | $263,945 | |
| Previous Owner | Brennan Terrence J | $184,000 |
Source: Public Records
Tax History Compared to Growth
Tax History
| Year | Tax Paid | Tax Assessment Tax Assessment Total Assessment is a certain percentage of the fair market value that is determined by local assessors to be the total taxable value of land and additions on the property. | Land | Improvement |
|---|---|---|---|---|
| 2025 | $6,570 | $218,040 | $50,000 | $168,040 |
| 2024 | $6,574 | $218,040 | $50,000 | $168,040 |
| 2023 | $6,023 | $199,760 | $40,000 | $159,760 |
| 2022 | $5,103 | $168,124 | $32,000 | $136,124 |
| 2021 | $4,633 | $152,648 | $32,000 | $120,648 |
| 2020 | $4,633 | $152,648 | $32,000 | $120,648 |
| 2019 | $4,178 | $137,652 | $32,000 | $105,652 |
| 2018 | $4,178 | $137,652 | $32,000 | $105,652 |
| 2017 | $3,289 | $114,416 | $32,000 | $82,416 |
| 2016 | $3,289 | $114,416 | $32,000 | $82,416 |
| 2015 | $2,952 | $100,196 | $32,000 | $68,196 |
| 2014 | $2,977 | $100,196 | $0 | $0 |
Source: Public Records
Map
Nearby Homes
- 2713 Arbor Summit
- 4259 Arbor Club Dr
- 4464 Windsor Oaks Dr
- 2696 S Arbor Dr
- 2578 Middle Coray Cir
- 2402 Woodbridge Dr
- 2610 Chadwick Rd
- 3901 Hazelhurst Dr
- 2603 Chadwick Rd
- 4050 Idlewilde Meadows Dr NE
- 2855 Lamer Trace
- 3043 Sawyer Trace NE
- 3798 Upland Dr
- 2842 Forest Chase Dr NE
- 4397 Windsor Oaks Cir
- 4499 Browning Ct NE
- 3851 Trickum Rd NE
- 2124 Lassiter Field Dr NE
- 2702 Arbor Summit
- 4198 Arbor Spring Dr
- 2696 Arbor Summit Unit 2
- 2699 Arbor Summit
- 2704 Arbor Summit
- 2701 Arbor Summit
- 4197 Arbor Spring Dr
- 2697 Arbor Summit
- 2694 Arbor Summit
- 2671 Arbor Spring Way Unit 2
- 2703 Arbor Summit
- 2675 Arbor Spring Way Unit 2
- 2673 Arbor Spring Way
- 4195 Arbor Spring Dr
- 2695 Arbor Summit
- 2706 Arbor Summit
- 2705 Arbor Summit Unit 2
- 2580 N Arbor Trail
- 4196 Arbor Club Dr Unit 2
- 2582 N Arbor Trail