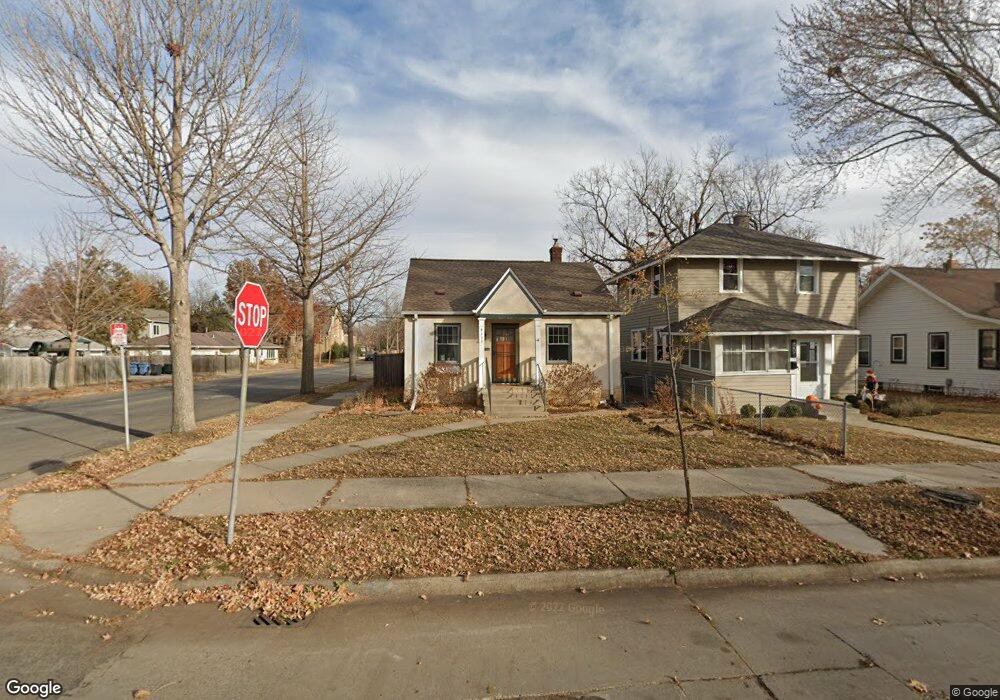
4201 40th Ave S Minneapolis, MN 55406
Hiawatha NeighborhoodEstimated Value: $318,000 - $347,000
2
Beds
2
Baths
1,312
Sq Ft
$257/Sq Ft
Est. Value
About This Home
This home is located at 4201 40th Ave S, Minneapolis, MN 55406 and is currently estimated at $337,142, approximately $256 per square foot. 4201 40th Ave S is a home located in Hennepin County with nearby schools including Hiawatha Community School, Howe Elementary School, and Sanford Middle School.
Ownership History
Date
Name
Owned For
Owner Type
Purchase Details
Closed on
Jul 29, 2021
Sold by
Reker Zoe C
Bought by
Dent Carly H
Current Estimated Value
Home Financials for this Owner
Home Financials are based on the most recent Mortgage that was taken out on this home.
Original Mortgage
$287,850
Outstanding Balance
$261,862
Interest Rate
2.93%
Mortgage Type
New Conventional
Estimated Equity
$75,280
Purchase Details
Closed on
May 31, 2017
Sold by
Haven Rebecca L
Bought by
Reker Zoe C
Home Financials for this Owner
Home Financials are based on the most recent Mortgage that was taken out on this home.
Original Mortgage
$180,000
Interest Rate
3.97%
Mortgage Type
New Conventional
Purchase Details
Closed on
Jun 29, 2007
Sold by
Johnson Andrea E
Bought by
Haven Rebecca L and Haven Robert L
Purchase Details
Closed on
Jan 29, 2002
Sold by
Kirchner Ralph T
Bought by
Johnson Andrea E
Create a Home Valuation Report for This Property
The Home Valuation Report is an in-depth analysis detailing your home's value as well as a comparison with similar homes in the area
Home Values in the Area
Average Home Value in this Area
Purchase History
| Date | Buyer | Sale Price | Title Company |
|---|---|---|---|
| Dent Carly H | $303,000 | Dca Title | |
| Reker Zoe C | $233,000 | Partners Title Llc | |
| Haven Rebecca L | $192,000 | -- | |
| Johnson Andrea E | $131,000 | -- | |
| Dent Carly Carly | $303,000 | -- |
Source: Public Records
Mortgage History
| Date | Status | Borrower | Loan Amount |
|---|---|---|---|
| Open | Dent Carly H | $287,850 | |
| Previous Owner | Reker Zoe C | $180,000 | |
| Closed | Dent Carly Carly | $287,850 |
Source: Public Records
Tax History Compared to Growth
Tax History
| Year | Tax Paid | Tax Assessment Tax Assessment Total Assessment is a certain percentage of the fair market value that is determined by local assessors to be the total taxable value of land and additions on the property. | Land | Improvement |
|---|---|---|---|---|
| 2024 | $4,151 | $297,000 | $117,000 | $180,000 |
| 2023 | $3,837 | $303,000 | $117,000 | $186,000 |
| 2022 | $3,131 | $276,000 | $96,000 | $180,000 |
| 2021 | $2,620 | $240,000 | $71,000 | $169,000 |
| 2020 | $2,623 | $212,000 | $27,700 | $184,300 |
| 2019 | $2,706 | $198,000 | $21,100 | $176,900 |
| 2018 | $2,231 | $198,000 | $21,100 | $176,900 |
| 2017 | $2,125 | $158,000 | $19,200 | $138,800 |
| 2016 | $2,197 | $158,000 | $19,200 | $138,800 |
| 2015 | $2,154 | $149,500 | $19,200 | $130,300 |
| 2014 | -- | $138,000 | $19,200 | $118,800 |
Source: Public Records
Map
Nearby Homes
- 4243 Minnehaha Ave
- 4026 39th Ave S
- 4324 41st Ave S
- 4121 45th Ave S
- 4217 45th Ave S
- 3852 39th Ave S
- 3841 41st Ave S
- 4336 46th Ave S
- 4520 41st Ave S
- 4201 33rd Ave S
- 3856 45th Ave S
- 3901 45th Ave S
- 4332 34th Ave S
- 4500 45th Ave S
- 4541 42nd Ave S
- 3848 Minnehaha Ave
- 4736 Coffey Ln
- 3860 Snelling Ave
- 4126 31st Ave S
- 3632 43rd Ave S
- 4205 40th Ave S
- 4209 40th Ave S
- 4157 40th Ave S
- 4215 40th Ave S
- 4157 4157 40th-Avenue-s
- 4200 41st Ave S
- 4204 41st Ave S
- 4217 40th Ave S
- 4151 40th Ave S
- 4208 41st Ave S
- 4212 41st Ave S
- 4018 E 42nd St
- 4200 40th Ave S
- 4204 40th Ave S
- 4221 40th Ave S
- 4149 40th Ave S
- 4208 40th Ave S
- 4216 41st Ave S
- 4150 41st Ave S
- 4212 40th Ave S