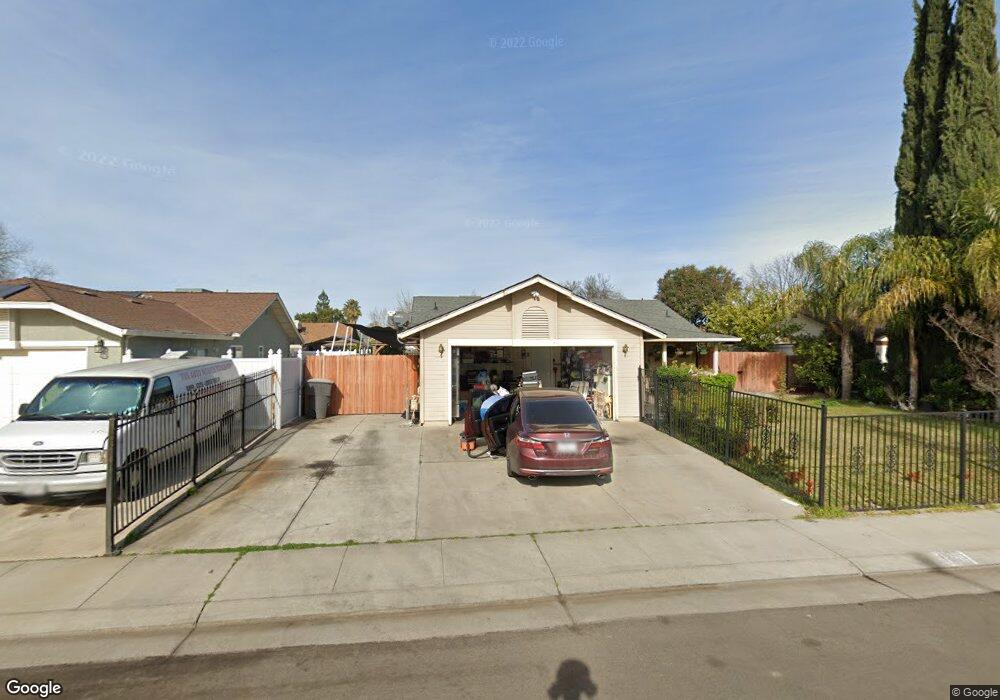
4203 Eagle Crest Dr Stockton, CA 95215
Garden Acres NeighborhoodEstimated Value: $397,000 - $429,000
3
Beds
2
Baths
1,343
Sq Ft
$307/Sq Ft
Est. Value
About This Home
This home is located at 4203 Eagle Crest Dr, Stockton, CA 95215 and is currently estimated at $412,627, approximately $307 per square foot. 4203 Eagle Crest Dr is a home located in San Joaquin County with nearby schools including Wilhelmina Henry Elementary School, Elmwood Elementary School, and Montezuma Elementary School.
Ownership History
Date
Name
Owned For
Owner Type
Purchase Details
Closed on
May 4, 2011
Sold by
Ooda Investments Llc
Bought by
Beltran Luis E Rios
Current Estimated Value
Home Financials for this Owner
Home Financials are based on the most recent Mortgage that was taken out on this home.
Original Mortgage
$88,000
Outstanding Balance
$61,043
Interest Rate
4.84%
Mortgage Type
New Conventional
Estimated Equity
$351,584
Purchase Details
Closed on
Jan 25, 2011
Sold by
Acevedo Arturo H and Acevedo Maria G
Bought by
O O D A Investments Llc
Purchase Details
Closed on
Jun 20, 2005
Sold by
Winchell Darell B
Bought by
Acevedo Arturo H and Acevedo Maria G
Home Financials for this Owner
Home Financials are based on the most recent Mortgage that was taken out on this home.
Original Mortgage
$66,000
Interest Rate
5.72%
Mortgage Type
Stand Alone Second
Purchase Details
Closed on
Feb 13, 2001
Sold by
Winchell Darell B and Winchell Edwina
Bought by
Winchell Darell B
Create a Home Valuation Report for This Property
The Home Valuation Report is an in-depth analysis detailing your home's value as well as a comparison with similar homes in the area
Home Values in the Area
Average Home Value in this Area
Purchase History
We collect this data history from publicly available records. To have your information removed, we recommend requesting removal directly through your county’s website.
| Date | Buyer | Sale Price | Title Company |
|---|---|---|---|
| Beltran Luis E Rios | $110,000 | Chicago Title Company | |
| O O D A Investments Llc | $85,100 | None Available | |
| Acevedo Arturo H | $330,000 | First Amer Title Co | |
| Winchell Darell B | -- | -- |
Source: Public Records
Mortgage History
We collect this data history from publicly available records. To have your information removed, we recommend requesting removal directly through your county’s website.
| Date | Status | Borrower | Loan Amount |
|---|---|---|---|
| Open | Beltran Luis E Rios | $88,000 | |
| Previous Owner | Acevedo Arturo H | $66,000 |
Source: Public Records
Tax History
| Year | Tax Paid | Tax Assessment Tax Assessment Total Assessment is a certain percentage of the fair market value that is determined by local assessors to be the total taxable value of land and additions on the property. | Land | Improvement |
|---|---|---|---|---|
| 2025 | $2,280 | $140,921 | $34,588 | $106,333 |
| 2024 | $1,799 | $138,159 | $33,910 | $104,249 |
| 2023 | $1,754 | $135,451 | $33,246 | $102,205 |
| 2022 | $1,669 | $132,796 | $32,595 | $100,201 |
| 2021 | $1,606 | $130,193 | $31,956 | $98,237 |
| 2020 | $1,634 | $128,859 | $31,629 | $97,230 |
| 2019 | $1,656 | $126,333 | $31,009 | $95,324 |
| 2018 | $1,626 | $123,856 | $30,401 | $93,455 |
| 2017 | $1,545 | $121,428 | $29,805 | $91,623 |
| 2016 | $1,569 | $119,048 | $29,221 | $89,827 |
| 2015 | $1,567 | $117,260 | $28,782 | $88,478 |
| 2014 | $1,496 | $114,963 | $28,218 | $86,745 |
Source: Public Records
Map
Nearby Homes
- 1321 White Owl Ln
- 4156 Guernsey Ave
- 4209 Section Ave
- 1335 S Kestrel Ln
- 939 S Coolidge Ave
- 840 S Gertrude Ave
- 741 S Oro Ave
- 1918 S Olive Ave
- 940 Del Mar Ave
- 3918 E 4th St
- 806 S Dawes Ave
- 949 S Rossi Ave
- 935 S Rossi Ave
- 910 Del Mar Ave
- 966 S Rossi Ave
- 884 Del Mar Ave
- 862 Del Mar Ave
- 840 Del Mar Ave
- 914 S Rossi Ave
- 808 Del Mar Ave
- 4215 Eagle Crest Dr
- 4191 Eagle Crest Dr
- 1274 White Owl Ln
- 1286 White Owl Ln
- 1262 White Owl Ln
- 4227 Eagle Crest Dr
- 4179 Eagle Crest Dr
- 1298 White Owl Ln
- 1250 White Owl Ln
- 4194 Eagle Crest Dr
- 4206 Eagle Crest Dr
- 4239 Eagle Crest Dr
- 1322 White Owl Ln
- 4182 Eagle Crest Dr
- 4218 Eagle Crest Dr
- 1310 White Owl Ln
- 4164 Eagle Crest Dr
- 4230 Eagle Crest Dr
- 1269 White Owl Ln
- 1255 White Owl Ln
Your Personal Tour Guide
Ask me questions while you tour the home.