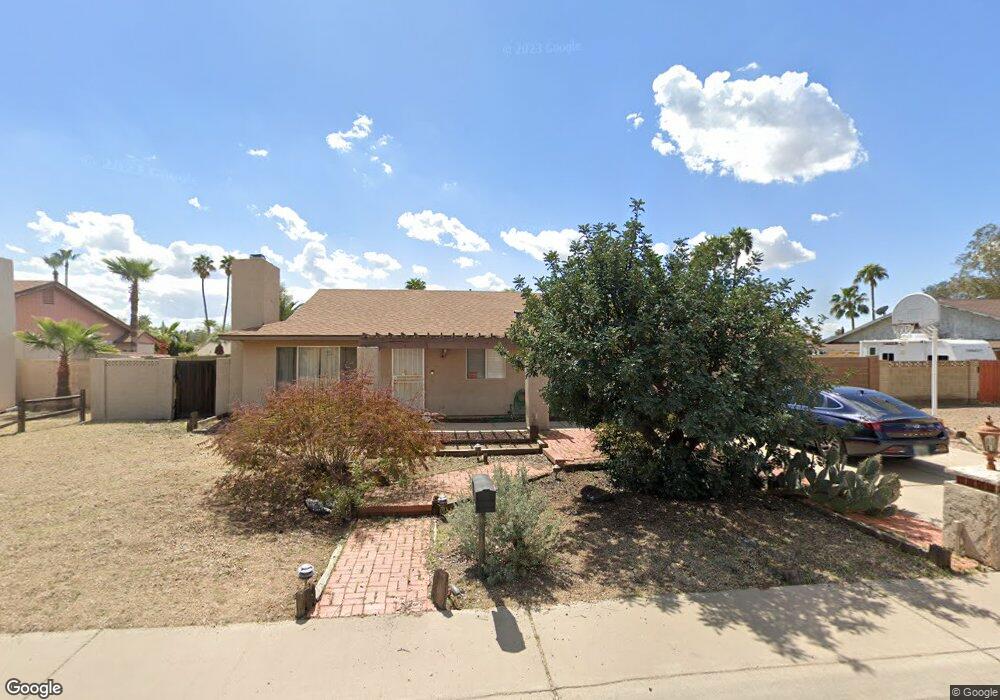
4209 E Hearn Rd Phoenix, AZ 85032
Paradise Valley Village NeighborhoodEstimated Value: $479,743 - $613,000
3
Beds
2
Baths
1,833
Sq Ft
$307/Sq Ft
Est. Value
About This Home
This home is located at 4209 E Hearn Rd, Phoenix, AZ 85032 and is currently estimated at $562,686, approximately $306 per square foot. 4209 E Hearn Rd is a home located in Maricopa County with nearby schools including Indian Bend Elementary School, Sunrise Middle School, and Paradise Valley High School.
Ownership History
Date
Name
Owned For
Owner Type
Purchase Details
Closed on
Aug 3, 2010
Sold by
Andrews Bradley Michael
Bought by
Andrews Lindsay Lee
Current Estimated Value
Home Financials for this Owner
Home Financials are based on the most recent Mortgage that was taken out on this home.
Original Mortgage
$152,049
Interest Rate
5.25%
Mortgage Type
FHA
Purchase Details
Closed on
Jul 1, 2010
Sold by
Deutsche Bank National Trust Company
Bought by
Andrews Lindsay
Home Financials for this Owner
Home Financials are based on the most recent Mortgage that was taken out on this home.
Original Mortgage
$152,049
Interest Rate
5.25%
Mortgage Type
FHA
Purchase Details
Closed on
Jul 10, 2009
Sold by
Zucker D Megha
Bought by
Deutsche Bank National Trust Company
Purchase Details
Closed on
Apr 17, 1996
Sold by
Jouas John and Jouas Debra J
Bought by
Zucher D Megha
Home Financials for this Owner
Home Financials are based on the most recent Mortgage that was taken out on this home.
Original Mortgage
$110,225
Interest Rate
7.96%
Mortgage Type
New Conventional
Create a Home Valuation Report for This Property
The Home Valuation Report is an in-depth analysis detailing your home's value as well as a comparison with similar homes in the area
Home Values in the Area
Average Home Value in this Area
Purchase History
| Date | Buyer | Sale Price | Title Company |
|---|---|---|---|
| Andrews Lindsay Lee | -- | Guaranty Title Agency | |
| Andrews Lindsay | $154,900 | Guaranty Title Agency | |
| Deutsche Bank National Trust Company | $164,495 | None Available | |
| Zucher D Megha | $117,600 | United Title Agency |
Source: Public Records
Mortgage History
| Date | Status | Borrower | Loan Amount |
|---|---|---|---|
| Previous Owner | Andrews Lindsay | $152,049 | |
| Previous Owner | Zucher D Megha | $110,225 |
Source: Public Records
Tax History
| Year | Tax Paid | Tax Assessment Tax Assessment Total Assessment is a certain percentage of the fair market value that is determined by local assessors to be the total taxable value of land and additions on the property. | Land | Improvement |
|---|---|---|---|---|
| 2025 | $2,414 | $27,879 | -- | -- |
| 2024 | $2,298 | $26,551 | -- | -- |
| 2023 | $2,298 | $39,130 | $7,820 | $31,310 |
| 2022 | $2,277 | $30,150 | $6,030 | $24,120 |
| 2021 | $2,315 | $28,250 | $5,650 | $22,600 |
| 2020 | $2,235 | $26,180 | $5,230 | $20,950 |
| 2019 | $2,245 | $24,950 | $4,990 | $19,960 |
| 2018 | $2,164 | $22,680 | $4,530 | $18,150 |
| 2017 | $2,066 | $22,130 | $4,420 | $17,710 |
| 2016 | $2,034 | $20,810 | $4,160 | $16,650 |
| 2015 | $1,887 | $20,060 | $4,010 | $16,050 |
Source: Public Records
Map
Nearby Homes
- 14043 N 41st St
- 4209 E Acoma Dr
- 4350 E Winchcomb Dr
- 13829 N 43rd St
- 4302 E Acoma Dr
- 13818 N 43rd St
- 4209 E Everett Dr
- 14010 N 40th Place
- 13813 N 43rd St
- 4316 E Ludlow Dr
- 13805 N 43rd St
- 14607 N 40th Place
- 14611 N 40th Place
- 4162 E Whitney Ln
- 13616 N 41st Place
- 4101 E Nisbet Rd
- 4095 E Nisbet Rd
- 3763 E Evans Dr
- 13822 N 38th Place
- 14811 N 44th Place
- 4217 E Hearn Rd
- 4201 E Hearn Rd
- 4210 E Redfield Rd
- 4218 E Redfield Rd
- 4212 E Hearn Rd
- 4202 E Hearn Rd
- 4223 E Hearn Rd
- 4202 E Redfield Rd
- 4226 E Redfield Rd
- 4224 E Hearn Rd
- 14224 N 42nd Place
- 4234 E Redfield Rd
- 14223 N 42nd St
- 4231 E Hearn Rd
- 14043 N 41st Place
- 14049 N 41st Place
- 14223 N 42nd Place
- 14037 N 41st Place
- 4201 E Redfield Rd
- 14202 N 43rd St
Your Personal Tour Guide
Ask me questions while you tour the home.