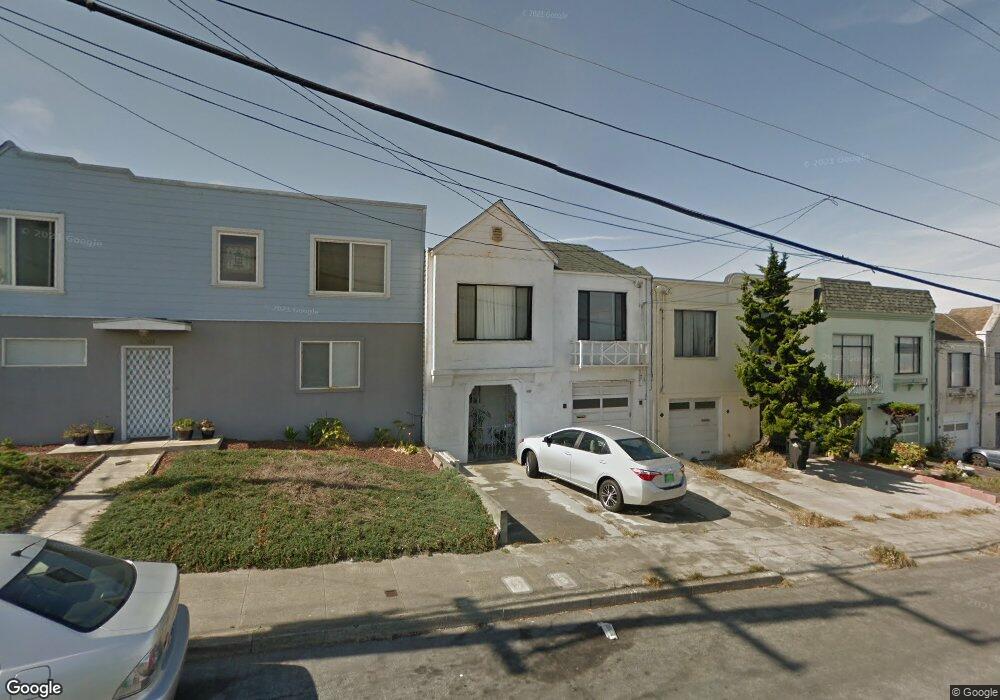
4209 Ulloa St San Francisco, CA 94116
Outer Parkside NeighborhoodEstimated Value: $1,026,000 - $1,419,000
3
Beds
2
Baths
800
Sq Ft
$1,600/Sq Ft
Est. Value
About This Home
This home is located at 4209 Ulloa St, San Francisco, CA 94116 and is currently estimated at $1,280,344, approximately $1,600 per square foot. 4209 Ulloa St is a home located in San Francisco County with nearby schools including Ulloa Elementary School, Hoover (Herbert) Middle School, and St. Gabriel School.
Ownership History
Date
Name
Owned For
Owner Type
Purchase Details
Closed on
Feb 28, 2017
Sold by
Chan Paul
Bought by
Gluck Janos
Current Estimated Value
Home Financials for this Owner
Home Financials are based on the most recent Mortgage that was taken out on this home.
Original Mortgage
$740,000
Outstanding Balance
$612,279
Interest Rate
4.09%
Mortgage Type
New Conventional
Estimated Equity
$668,065
Purchase Details
Closed on
Jul 10, 2016
Sold by
Chen Qihua
Bought by
Chan Paul
Purchase Details
Closed on
Jul 7, 2016
Sold by
Hsueh Ken Chien and Hsueh Lloyd Lo
Bought by
Chan Paul
Purchase Details
Closed on
May 28, 1997
Sold by
Zhang Gary Y Z and Jie Chang G
Bought by
Hsueh Ken Chien and Hsueh Lloyd Lo
Home Financials for this Owner
Home Financials are based on the most recent Mortgage that was taken out on this home.
Original Mortgage
$165,000
Interest Rate
8.13%
Create a Home Valuation Report for This Property
The Home Valuation Report is an in-depth analysis detailing your home's value as well as a comparison with similar homes in the area
Home Values in the Area
Average Home Value in this Area
Purchase History
| Date | Buyer | Sale Price | Title Company |
|---|---|---|---|
| Gluck Janos | $925,000 | Old Republic Title Company | |
| Chan Paul | -- | Chicago Title Company | |
| Chan Paul | $675,000 | Chicago Title Company | |
| Hsueh Ken Chien | $245,000 | Old Republic Title Company |
Source: Public Records
Mortgage History
| Date | Status | Borrower | Loan Amount |
|---|---|---|---|
| Open | Gluck Janos | $740,000 | |
| Previous Owner | Hsueh Ken Chien | $165,000 |
Source: Public Records
Tax History Compared to Growth
Tax History
| Year | Tax Paid | Tax Assessment Tax Assessment Total Assessment is a certain percentage of the fair market value that is determined by local assessors to be the total taxable value of land and additions on the property. | Land | Improvement |
|---|---|---|---|---|
| 2025 | $13,118 | $1,073,535 | $751,476 | $322,059 |
| 2024 | $13,118 | $1,052,487 | $736,742 | $315,745 |
| 2023 | $12,918 | $1,031,851 | $722,297 | $309,554 |
| 2022 | $12,667 | $1,011,620 | $708,135 | $303,485 |
| 2021 | $12,441 | $991,785 | $694,250 | $297,535 |
| 2020 | $12,554 | $981,617 | $687,132 | $294,485 |
| 2019 | $12,127 | $962,370 | $673,659 | $288,711 |
| 2018 | $11,716 | $943,500 | $660,450 | $283,050 |
| 2017 | $8,350 | $675,000 | $472,500 | $202,500 |
| 2016 | $4,244 | $337,042 | $275,150 | $61,892 |
| 2015 | $4,189 | $331,982 | $271,018 | $60,964 |
| 2014 | $4,078 | $325,480 | $265,710 | $59,770 |
Source: Public Records
Map
Nearby Homes
- 3400 Vicente St
- 2395 44th Ave
- 2675 45th Ave
- 2687 45th Ave
- 3421 Rivera St
- 3622 Rivera St
- 2142 43rd Ave
- 2115 42nd Ave
- 2274 36th Ave
- 2275 35th Ave
- 2225 Vicente St Unit 1
- 2225 Vicente St
- 2430 33rd Ave
- 2026 Great Hwy
- 2139 Taraval St
- 2555 31st Ave
- 2363 31st Ave
- 1927 Taraval St
- 1871 45th Ave
- 74 Everglade Dr