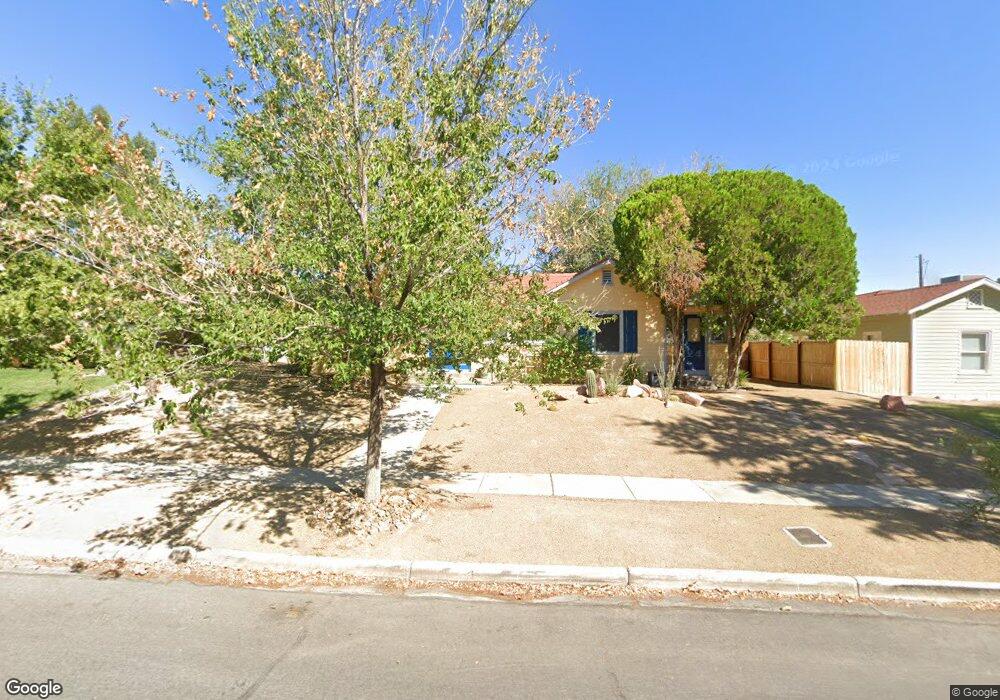
421 Ash St Boulder City, NV 89005
Estimated Value: $467,102 - $523,000
2
Beds
1
Bath
1,354
Sq Ft
$364/Sq Ft
Est. Value
About This Home
This home is located at 421 Ash St, Boulder City, NV 89005 and is currently estimated at $492,526, approximately $363 per square foot. 421 Ash St is a home located in Clark County with nearby schools including Andrew Mitchell Elementary School, Martha P. King Elementary School, and Elton M. & Madelaine E. Garrett Junior High School.
Ownership History
Date
Name
Owned For
Owner Type
Purchase Details
Closed on
Apr 17, 2002
Sold by
Freitag Elizabeth Ann
Bought by
Freitag Freeman
Current Estimated Value
Home Financials for this Owner
Home Financials are based on the most recent Mortgage that was taken out on this home.
Original Mortgage
$105,000
Outstanding Balance
$43,714
Interest Rate
6.87%
Estimated Equity
$448,812
Purchase Details
Closed on
Aug 19, 1995
Sold by
Hutt Allan J and Nicholson Rachel H
Bought by
Freitag Freeman and Freitag Elizabeth Ann
Home Financials for this Owner
Home Financials are based on the most recent Mortgage that was taken out on this home.
Original Mortgage
$110,800
Interest Rate
7.63%
Create a Home Valuation Report for This Property
The Home Valuation Report is an in-depth analysis detailing your home's value as well as a comparison with similar homes in the area
Home Values in the Area
Average Home Value in this Area
Purchase History
| Date | Buyer | Sale Price | Title Company |
|---|---|---|---|
| Freitag Freeman | -- | Nevada Title Company | |
| Freitag Freeman | $138,500 | United Title |
Source: Public Records
Mortgage History
| Date | Status | Borrower | Loan Amount |
|---|---|---|---|
| Open | Freitag Freeman | $105,000 | |
| Closed | Freitag Freeman | $110,800 |
Source: Public Records
Tax History Compared to Growth
Tax History
| Year | Tax Paid | Tax Assessment Tax Assessment Total Assessment is a certain percentage of the fair market value that is determined by local assessors to be the total taxable value of land and additions on the property. | Land | Improvement |
|---|---|---|---|---|
| 2025 | $1,034 | $76,274 | $53,900 | $22,374 |
| 2024 | $1,004 | $76,274 | $53,900 | $22,374 |
| 2023 | $1,004 | $60,600 | $40,425 | $20,175 |
| 2022 | $975 | $54,603 | $36,575 | $18,028 |
| 2021 | $946 | $50,298 | $33,495 | $16,803 |
| 2020 | $902 | $47,254 | $31,570 | $15,684 |
| 2019 | $876 | $44,038 | $28,875 | $15,163 |
| 2018 | $850 | $39,260 | $25,025 | $14,235 |
| 2017 | $972 | $37,203 | $23,100 | $14,103 |
| 2016 | $805 | $31,618 | $17,325 | $14,293 |
| 2015 | $803 | $30,365 | $16,538 | $13,827 |
| 2014 | $780 | $29,215 | $16,538 | $12,677 |
Source: Public Records
Map
Nearby Homes