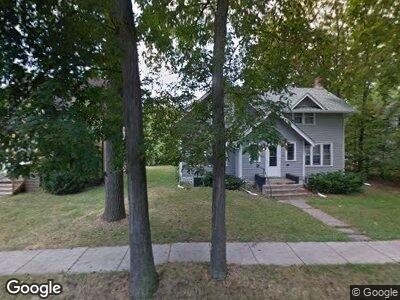
421 Charles St East Lansing, MI 48823
Estimated Value: $332,000 - $541,953
8
Beds
2
Baths
2,022
Sq Ft
$200/Sq Ft
Est. Value
About This Home
This home is located at 421 Charles St, East Lansing, MI 48823 and is currently estimated at $404,738, approximately $200 per square foot. 421 Charles St is a home located in Ingham County with nearby schools including Marble Elementary School, MacDonald Middle School, and East Lansing High School.
Ownership History
Date
Name
Owned For
Owner Type
Purchase Details
Closed on
Apr 3, 2009
Sold by
Irvine F Owen and Irvine Melinda
Bought by
King Charles Properties Llc
Current Estimated Value
Home Financials for this Owner
Home Financials are based on the most recent Mortgage that was taken out on this home.
Original Mortgage
$238,000
Interest Rate
5.11%
Mortgage Type
Stand Alone Refi Refinance Of Original Loan
Purchase Details
Closed on
Dec 1, 1985
Purchase Details
Closed on
Aug 1, 1974
Create a Home Valuation Report for This Property
The Home Valuation Report is an in-depth analysis detailing your home's value as well as a comparison with similar homes in the area
Home Values in the Area
Average Home Value in this Area
Purchase History
| Date | Buyer | Sale Price | Title Company |
|---|---|---|---|
| King Charles Properties Llc | -- | Summit | |
| Irvine F Owen | -- | Summit | |
| -- | $75,500 | -- | |
| -- | $38,300 | -- |
Source: Public Records
Mortgage History
| Date | Status | Borrower | Loan Amount |
|---|---|---|---|
| Closed | Irvine F Owen | $238,000 |
Source: Public Records
Tax History Compared to Growth
Tax History
| Year | Tax Paid | Tax Assessment Tax Assessment Total Assessment is a certain percentage of the fair market value that is determined by local assessors to be the total taxable value of land and additions on the property. | Land | Improvement |
|---|---|---|---|---|
| 2024 | -- | $195,000 | $28,400 | $166,600 |
| 2023 | $6,286 | $178,800 | $25,100 | $153,700 |
| 2022 | $6,014 | $157,500 | $22,700 | $134,800 |
| 2021 | $5,889 | $148,200 | $20,100 | $128,100 |
| 2020 | $5,820 | $148,200 | $20,600 | $127,600 |
| 2019 | $5,614 | $148,200 | $23,400 | $124,800 |
| 2018 | $5,974 | $143,800 | $22,400 | $121,400 |
| 2017 | $5,763 | $139,700 | $25,300 | $114,400 |
| 2016 | -- | $137,000 | $25,100 | $111,900 |
| 2015 | -- | $131,700 | $48,536 | $83,164 |
| 2014 | -- | $131,700 | $48,190 | $83,510 |
Source: Public Records
Map
Nearby Homes
- 527 Beech St
- 420 Bailey St
- 220 Mac Ave Unit 212
- 254 Ridge Rd
- 645 Evergreen Ave
- 600 Albert Ave Unit 320
- 539 Sunset Ln
- 835 Westlawn Ave
- 464 Rosewood Ave
- 1124 Burcham Dr
- 1130 Old Hickory Ln
- 620 Ardson Rd
- 615 Southlawn Ave
- 610 Glenhaven Ave
- 525 Northlawn Ave
- 603 N Harrison Rd
- 508 Lexington Ave
- 303 Chesterfield Pkwy
- 134 Loree Dr
- 1025 Wildwood Dr