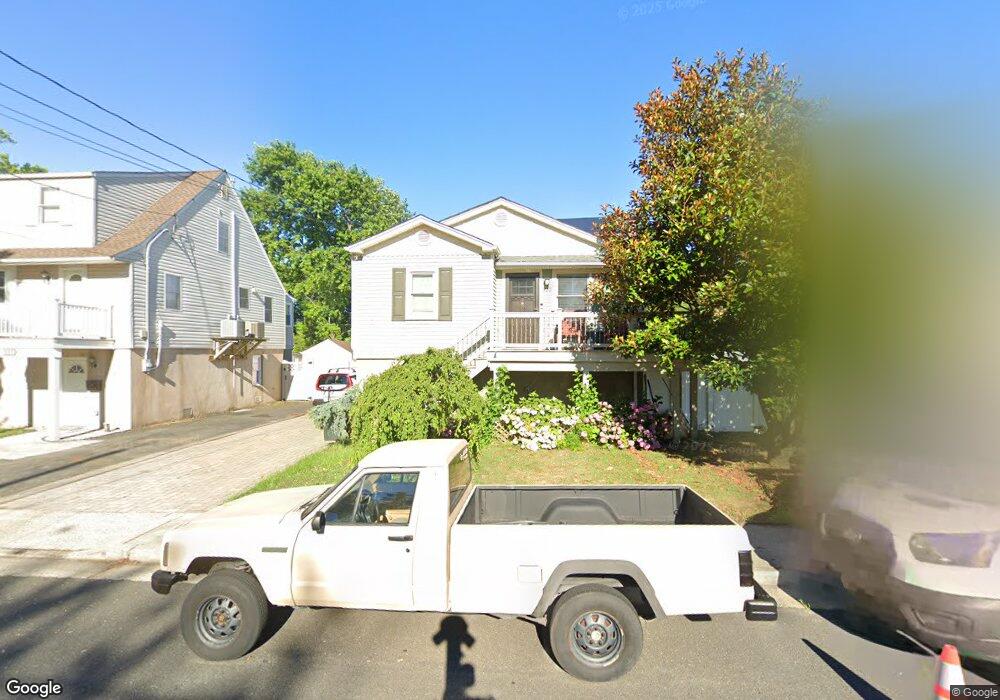
421 Dock St Union Beach, NJ 07735
Estimated Value: $432,000 - $486,877
2
Beds
1
Bath
901
Sq Ft
$507/Sq Ft
Est. Value
About This Home
This home is located at 421 Dock St, Union Beach, NJ 07735 and is currently estimated at $456,969, approximately $507 per square foot. 421 Dock St is a home located in Monmouth County with nearby schools including Memorial School, Icob Academy, and St. Joseph Elementary School.
Ownership History
Date
Name
Owned For
Owner Type
Purchase Details
Closed on
Jun 1, 2022
Sold by
Jean Cresci Felicia
Bought by
Corio Joseph L and Chadbourne Victoria A
Current Estimated Value
Home Financials for this Owner
Home Financials are based on the most recent Mortgage that was taken out on this home.
Original Mortgage
$375,250
Outstanding Balance
$356,990
Interest Rate
5.25%
Mortgage Type
New Conventional
Estimated Equity
$99,979
Purchase Details
Closed on
Mar 15, 2013
Sold by
Cresci Jonathan and Brodeur Danielle
Bought by
Cresci Victor and Brodeur Danielle
Purchase Details
Closed on
Aug 23, 2011
Sold by
Seelamsetty Prabhakar
Bought by
Cresci Jonathan and Brodeur Danielle
Purchase Details
Closed on
May 5, 2010
Sold by
Cresci Victor S
Bought by
Seelamsetty Prabhakar
Home Financials for this Owner
Home Financials are based on the most recent Mortgage that was taken out on this home.
Original Mortgage
$120,000
Interest Rate
12%
Mortgage Type
Purchase Money Mortgage
Purchase Details
Closed on
Apr 11, 2002
Sold by
Hull Frank
Bought by
Cresci Victor
Home Financials for this Owner
Home Financials are based on the most recent Mortgage that was taken out on this home.
Original Mortgage
$116,000
Interest Rate
6.81%
Mortgage Type
Purchase Money Mortgage
Purchase Details
Closed on
Jan 31, 2000
Sold by
Hud
Bought by
Hull Frank
Home Financials for this Owner
Home Financials are based on the most recent Mortgage that was taken out on this home.
Original Mortgage
$90,593
Interest Rate
7.91%
Mortgage Type
FHA
Purchase Details
Closed on
Jun 28, 1996
Sold by
Estate Of Timothy Foley
Bought by
Fasio Lino
Home Financials for this Owner
Home Financials are based on the most recent Mortgage that was taken out on this home.
Original Mortgage
$102,000
Interest Rate
7.98%
Mortgage Type
FHA
Create a Home Valuation Report for This Property
The Home Valuation Report is an in-depth analysis detailing your home's value as well as a comparison with similar homes in the area
Home Values in the Area
Average Home Value in this Area
Purchase History
| Date | Buyer | Sale Price | Title Company |
|---|---|---|---|
| Corio Joseph L | $395,000 | Chicago Title | |
| Corio Joseph L | $395,000 | Chicago Title | |
| Cresci Victor | -- | Trident Abst Title Ag Llc | |
| Cresci Jonathan | $162,500 | Multiple | |
| Seelamsetty Prabhakar | $135,000 | None Available | |
| Cresci Victor | $145,000 | -- | |
| Hull Frank | $93,300 | -- | |
| Fasio Lino | $104,500 | -- |
Source: Public Records
Mortgage History
| Date | Status | Borrower | Loan Amount |
|---|---|---|---|
| Open | Corio Joseph L | $375,250 | |
| Closed | Corio Joseph L | $375,250 | |
| Previous Owner | Seelamsetty Prabhakar | $120,000 | |
| Previous Owner | Cresci Victor | $116,000 | |
| Previous Owner | Hull Frank | $90,593 | |
| Previous Owner | Fasio Lino | $102,000 |
Source: Public Records
Tax History
| Year | Tax Paid | Tax Assessment Tax Assessment Total Assessment is a certain percentage of the fair market value that is determined by local assessors to be the total taxable value of land and additions on the property. | Land | Improvement |
|---|---|---|---|---|
| 2025 | $8,467 | $453,100 | $248,100 | $205,000 |
| 2024 | $7,503 | $410,600 | $215,600 | $195,000 |
Source: Public Records
Map
Nearby Homes
Your Personal Tour Guide
Ask me questions while you tour the home.