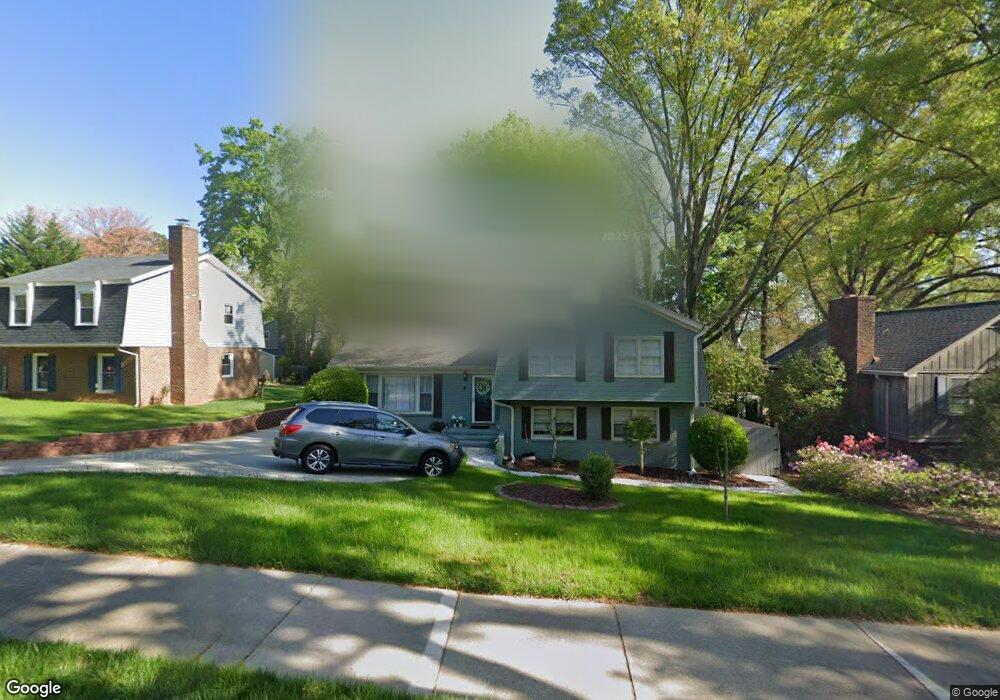
421 E Millbrook Rd Raleigh, NC 27609
North Hills NeighborhoodEstimated Value: $619,036 - $696,000
4
Beds
2
Baths
1,995
Sq Ft
$330/Sq Ft
Est. Value
About This Home
This home is located at 421 E Millbrook Rd, Raleigh, NC 27609 and is currently estimated at $658,509, approximately $330 per square foot. 421 E Millbrook Rd is a home located in Wake County with nearby schools including Douglas Elementary, Carroll Middle, and Sanderson High School.
Ownership History
Date
Name
Owned For
Owner Type
Purchase Details
Closed on
Aug 7, 2020
Sold by
Mahdi Wisam M
Bought by
Mahdi Wisam Mundher and Ahmed Suhad Shihab
Current Estimated Value
Home Financials for this Owner
Home Financials are based on the most recent Mortgage that was taken out on this home.
Original Mortgage
$50,000
Outstanding Balance
$44,354
Interest Rate
3%
Mortgage Type
Stand Alone Second
Estimated Equity
$614,155
Purchase Details
Closed on
Aug 26, 2010
Sold by
Gianakos Brady L
Bought by
Mahdi Wisam M
Home Financials for this Owner
Home Financials are based on the most recent Mortgage that was taken out on this home.
Original Mortgage
$80,000
Interest Rate
4.36%
Mortgage Type
New Conventional
Purchase Details
Closed on
Feb 24, 2005
Sold by
Paige Clyde T and Paige Patricia E
Bought by
Gianakos Brady L
Home Financials for this Owner
Home Financials are based on the most recent Mortgage that was taken out on this home.
Original Mortgage
$131,100
Interest Rate
5.68%
Mortgage Type
New Conventional
Create a Home Valuation Report for This Property
The Home Valuation Report is an in-depth analysis detailing your home's value as well as a comparison with similar homes in the area
Home Values in the Area
Average Home Value in this Area
Purchase History
| Date | Buyer | Sale Price | Title Company |
|---|---|---|---|
| Mahdi Wisam Mundher | -- | Servicelink East | |
| Mahdi Wisam Mundher | -- | None Listed On Document | |
| Mahdi Wisam M | $165,000 | None Available | |
| Gianakos Brady L | $138,000 | -- |
Source: Public Records
Mortgage History
| Date | Status | Borrower | Loan Amount |
|---|---|---|---|
| Open | Mahdi Wisam Mundher | $50,000 | |
| Closed | Mahdi Wisam Mundher | $50,000 | |
| Previous Owner | Mahdi Wisam M | $80,000 | |
| Previous Owner | Gianakos Brady L | $131,100 |
Source: Public Records
Tax History
| Year | Tax Paid | Tax Assessment Tax Assessment Total Assessment is a certain percentage of the fair market value that is determined by local assessors to be the total taxable value of land and additions on the property. | Land | Improvement |
|---|---|---|---|---|
| 2025 | $4,323 | $493,441 | $300,000 | $193,441 |
| 2024 | $4,306 | $493,441 | $300,000 | $193,441 |
Source: Public Records
Map
Nearby Homes
- 425 E Millbrook Rd
- 4900 Great Meadows Ct
- 4921 Sweetbriar Dr
- 304 Windel Dr
- 5219 Knollwood Rd
- 621 Duke Dr
- 5130 Flint Ridge Place Unit 5130
- 5080 Flint Ridge Place Unit 5080
- 420 Chadwick Dr
- 318 E Millbrook Rd
- 5073 Tall Pines Ct Unit 5073
- 717 E Millbrook Rd Unit 717
- 635 Pine Ridge Place
- 677 Pine Ridge Place
- 667 Pine Ridge Place
- 5021 Tall Pines Ct
- 305 E Millbrook Rd
- 204 Windel Dr
- 4700 Stonehill Dr
- 5508 Sweetbriar Dr
- 417 E Millbrook Rd
- 408 Crescent Ct
- 413 E Millbrook Rd
- 429 E Millbrook Rd
- 412 Crescent Ct
- 404 Crescent Ct
- 416 Crescent Ct
- 409 E Millbrook Rd
- 5320 Edgewood Rd
- 416 E Millbrook Rd
- 433 E Millbrook Rd
- 4919 Great Meadows Ct
- 420 Crescent Ct
- 440 Millbrook Rd
- 400 Crescent Ct
- 5316 Edgewood Rd
- 437 E Millbrook Rd
- 436 E Millbrook Rd
- 405 Crescent Ct
- 409 Crescent Ct
Your Personal Tour Guide
Ask me questions while you tour the home.