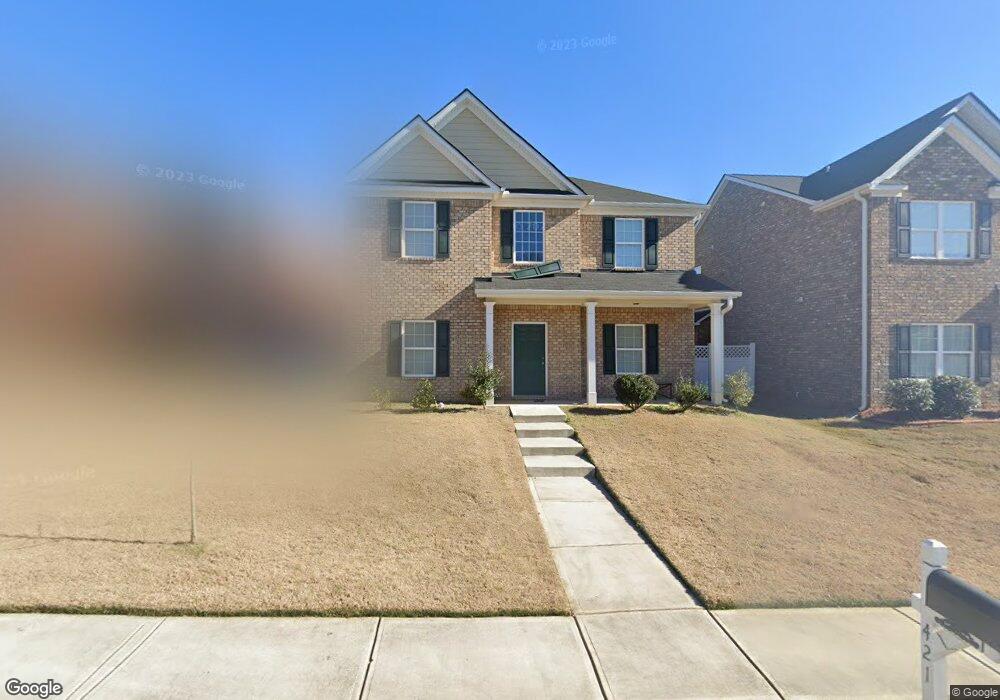
421 Townsend Bend Unit 129 Stockbridge, GA 30281
Estimated Value: $319,222 - $350,000
5
Beds
3
Baths
2,676
Sq Ft
$125/Sq Ft
Est. Value
About This Home
This home is located at 421 Townsend Bend Unit 129, Stockbridge, GA 30281 and is currently estimated at $334,056, approximately $124 per square foot. 421 Townsend Bend Unit 129 is a home located in Henry County with nearby schools including Stockbridge Elementary School, Smith-Barnes Elementary School, and Stockbridge Middle School.
Ownership History
Date
Name
Owned For
Owner Type
Purchase Details
Closed on
Oct 20, 2021
Sold by
Jalloh Fatoumata
Bought by
Jalloh Fatoumata and Jalloh Djiba
Current Estimated Value
Purchase Details
Closed on
Aug 29, 2019
Sold by
Nbc Homes Llc
Bought by
Jalloh Fatoumata
Home Financials for this Owner
Home Financials are based on the most recent Mortgage that was taken out on this home.
Original Mortgage
$215,916
Interest Rate
4.75%
Mortgage Type
FHA
Purchase Details
Closed on
Feb 26, 2019
Sold by
Henry Property Grp Llc
Bought by
Nbc Homes Llc
Home Financials for this Owner
Home Financials are based on the most recent Mortgage that was taken out on this home.
Original Mortgage
$420,000
Interest Rate
4.4%
Mortgage Type
Commercial
Purchase Details
Closed on
Aug 31, 2017
Sold by
Not Provided
Bought by
Henry Property Grp Llc
Purchase Details
Closed on
Jun 6, 2012
Sold by
Reo Ga Land Llc
Bought by
Lot Source I Llc
Create a Home Valuation Report for This Property
The Home Valuation Report is an in-depth analysis detailing your home's value as well as a comparison with similar homes in the area
Home Values in the Area
Average Home Value in this Area
Purchase History
| Date | Buyer | Sale Price | Title Company |
|---|---|---|---|
| Jalloh Fatoumata | -- | -- | |
| Jalloh Fatoumata | $219,900 | -- | |
| Nbc Homes Llc | $97,500 | -- | |
| Henry Property Grp Llc | $115,000 | -- | |
| Lot Source I Llc | $28,000 | -- |
Source: Public Records
Mortgage History
| Date | Status | Borrower | Loan Amount |
|---|---|---|---|
| Previous Owner | Jalloh Fatoumata | $215,916 | |
| Previous Owner | Nbc Homes Llc | $420,000 |
Source: Public Records
Tax History
| Year | Tax Paid | Tax Assessment Tax Assessment Total Assessment is a certain percentage of the fair market value that is determined by local assessors to be the total taxable value of land and additions on the property. | Land | Improvement |
|---|---|---|---|---|
| 2025 | $4,978 | $147,600 | $16,000 | $131,600 |
| 2024 | $4,978 | $141,360 | $16,000 | $125,360 |
| 2023 | $4,519 | $144,280 | $18,000 | $126,280 |
| 2022 | $4,080 | $120,400 | $12,800 | $107,600 |
| 2021 | $3,430 | $92,920 | $12,800 | $80,120 |
| 2020 | $3,559 | $87,120 | $12,800 | $74,320 |
| 2019 | $353 | $10,000 | $10,000 | $0 |
| 2018 | $353 | $9,200 | $9,200 | $0 |
| 2016 | $230 | $6,000 | $6,000 | $0 |
| 2015 | $190 | $4,800 | $4,800 | $0 |
| 2014 | $183 | $4,560 | $4,560 | $0 |
Source: Public Records
Map
Nearby Homes
- 809 Winsap Dr
- 640 Armitage Way
- 677 Armitage Way
- 431 Broder Farms Dr
- 0 Hwy 138 Unit 13974666
- 0 Hwy 138 Unit 10694068
- 605 Samantha Cir
- 105 Woodhaven Dr
- 73 Lillian Cir
- 173 Brush Creek Ct
- 652 Rayella Dr
- 185 Brush Creek Ct
- 189 Brush Creek Ct
- 193 Brush Creek Ct
- 197 Brush Creek Ct
- 201 Brush Creek Ct
- 5708 N Henry Blvd
- 0 Dobbins Dr Unit 10677533
- 164 Adrian Dr
- 306 Iron Horse Way
- 421 Townsend Bend
- 417 Townsend Bend Unit 128
- 417 Townsend Bend
- 425 Townsend Bend
- 425 Townsend Bend Unit 130
- 429 Townsend Bend
- 429 Townsend Bend Unit 131
- 413 Townsend Bend
- 612 Armitage Way
- 612 Armitage Way Unit 123
- 608 Armitage Way
- 608 Armitage Way Unit 124
- 616 Armitage Way
- 616 Armitage Way Unit 122
- 433 Townsend Bend
- 433 Townsend Bend Unit 132
- 604 Armitage Way Unit 125
- 604 Armitage Way
- 620 Armitage Way
- 620 Armitage Way Unit 121
Your Personal Tour Guide
Ask me questions while you tour the home.