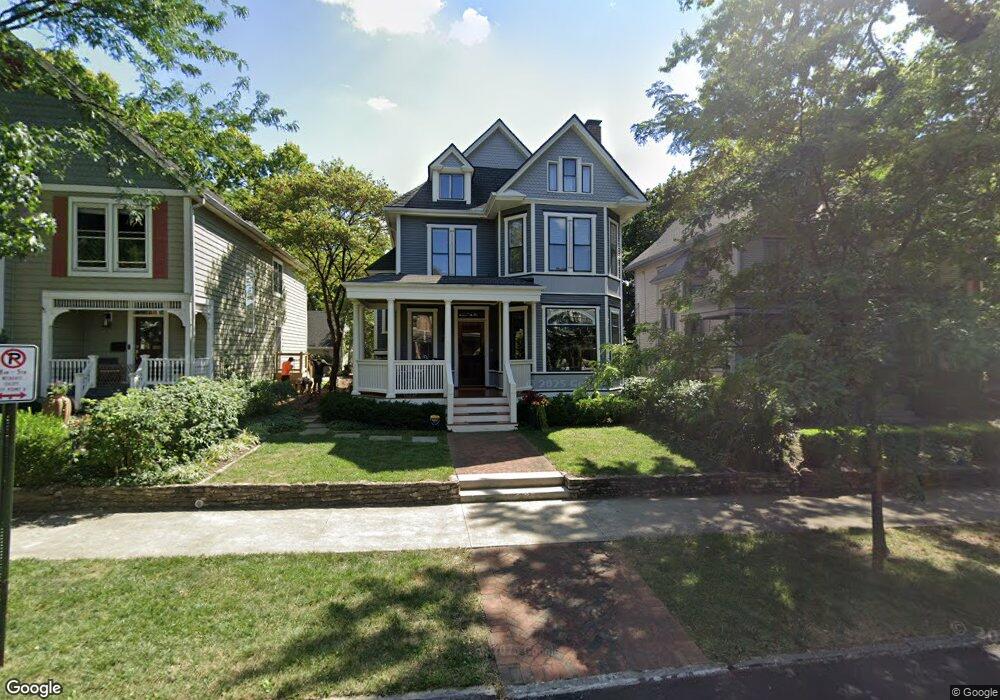
421 W 6th Ave Columbus, OH 43201
Dennison Place NeighborhoodEstimated Value: $645,000 - $744,000
3
Beds
3
Baths
2,375
Sq Ft
$288/Sq Ft
Est. Value
About This Home
This home is located at 421 W 6th Ave, Columbus, OH 43201 and is currently estimated at $685,140, approximately $288 per square foot. 421 W 6th Ave is a home located in Franklin County with nearby schools including Hubbard Elementary School, Dominion Middle School, and Whetstone High School.
Ownership History
Date
Name
Owned For
Owner Type
Purchase Details
Closed on
Jun 28, 2011
Sold by
Spafford David and Spafford David Y
Bought by
Hersey Stephen J and Kroger Kent M
Current Estimated Value
Home Financials for this Owner
Home Financials are based on the most recent Mortgage that was taken out on this home.
Original Mortgage
$367,500
Interest Rate
3.62%
Mortgage Type
Adjustable Rate Mortgage/ARM
Purchase Details
Closed on
Apr 14, 2009
Sold by
Frank Steven M and Russell Gooden R
Bought by
Spafford David
Home Financials for this Owner
Home Financials are based on the most recent Mortgage that was taken out on this home.
Original Mortgage
$287,200
Interest Rate
5.05%
Mortgage Type
Purchase Money Mortgage
Purchase Details
Closed on
Jul 29, 1992
Bought by
Gooden R Russell
Purchase Details
Closed on
Jan 10, 1990
Purchase Details
Closed on
Feb 1, 1979
Create a Home Valuation Report for This Property
The Home Valuation Report is an in-depth analysis detailing your home's value as well as a comparison with similar homes in the area
Home Values in the Area
Average Home Value in this Area
Purchase History
| Date | Buyer | Sale Price | Title Company |
|---|---|---|---|
| Hersey Stephen J | $367,500 | Chicago Title | |
| Spafford David | $359,000 | Chicago Tit | |
| Gooden R Russell | $125,000 | -- | |
| -- | $93,000 | -- | |
| -- | $34,500 | -- |
Source: Public Records
Mortgage History
| Date | Status | Borrower | Loan Amount |
|---|---|---|---|
| Previous Owner | Hersey Stephen J | $367,500 | |
| Previous Owner | Spafford David | $287,200 |
Source: Public Records
Tax History
| Year | Tax Paid | Tax Assessment Tax Assessment Total Assessment is a certain percentage of the fair market value that is determined by local assessors to be the total taxable value of land and additions on the property. | Land | Improvement |
|---|---|---|---|---|
| 2025 | $8,852 | $197,230 | $63,880 | $133,350 |
| 2024 | $8,852 | $197,230 | $63,880 | $133,350 |
| 2023 | $8,739 | $197,230 | $63,880 | $133,350 |
| 2022 | $10,320 | $198,980 | $49,280 | $149,700 |
| 2021 | $10,338 | $198,980 | $49,280 | $149,700 |
| 2020 | $10,352 | $198,980 | $49,280 | $149,700 |
| 2019 | $9,319 | $153,620 | $37,910 | $115,710 |
| 2018 | $8,736 | $153,620 | $37,910 | $115,710 |
| 2017 | $9,313 | $153,620 | $37,910 | $115,710 |
| 2016 | $9,003 | $135,910 | $26,320 | $109,590 |
| 2015 | $8,173 | $135,910 | $26,320 | $109,590 |
| 2014 | $8,193 | $135,910 | $26,320 | $109,590 |
| 2013 | $3,673 | $123,550 | $23,940 | $99,610 |
Source: Public Records
Map
Nearby Homes
- 424 W 5th Ave Unit 424
- 422 W 6th Ave
- 398 W 5th Ave
- 396 W 7th Ave
- 402 W 7th Ave
- 325 W 6th Ave
- 512 Riverfront Ln
- 516 Riverfront Ln
- 502 Riverfront Ln
- 477 W 4th Ave
- 1359 Neil Ave
- 506 Riverfront Ln
- 1153 Pennsylvania Ave
- 1149 Harrison Ave
- 537 W 3rd Ave Unit 537
- 1103 Michigan Ave
- 1520 Neil Ave
- 316 W 3rd Ave
- 231 W 4th Ave
- 0 Bradley St
- 423 W 6th Ave
- 417 W 6th Ave
- 431 W 6th Ave Unit 433
- 411 W 6th Ave Unit 411
- 413 W 6th Ave Unit 413
- 428 W 5th Ave Unit 428
- 405 W 6th Ave
- 432 W 5th Ave Unit 432
- 1323 Michigan Ave
- 416 W 5th Ave Unit 416
- 436 W 5th Ave
- 420 W 5th Ave Unit 420
- 420 W 6th Ave
- 416 W 6th Ave
- 428 W 6th Ave
- 432 W 6th Ave
- 412 W 6th Ave
- 406 W 6th Ave
- 391 W 6th Ave
- 400 W 6th Ave
Your Personal Tour Guide
Ask me questions while you tour the home.