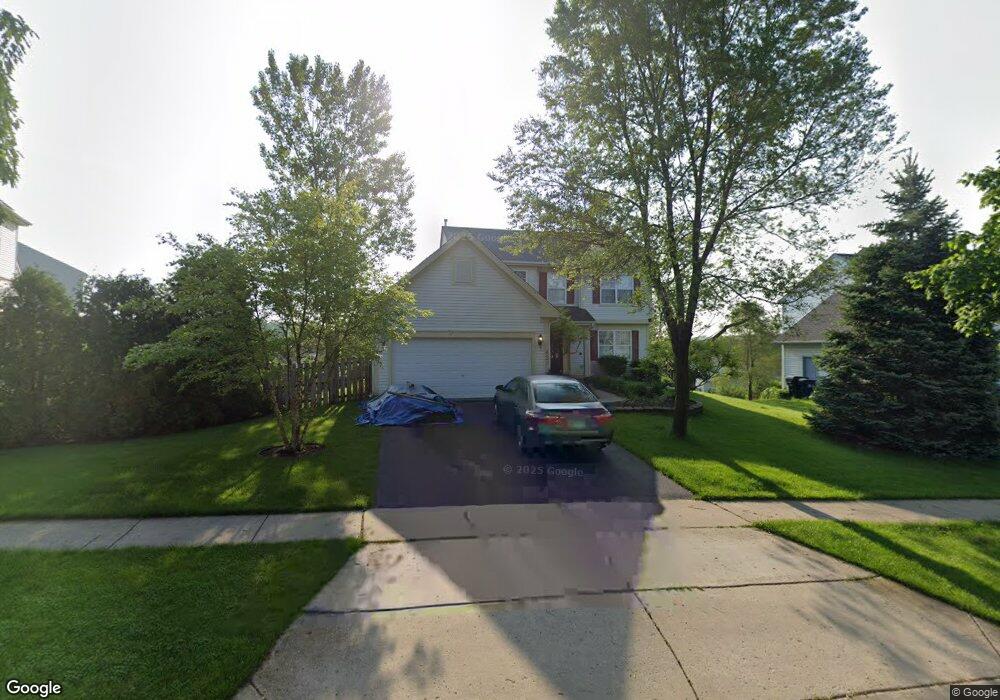
421 Winding Canyon Way Algonquin, IL 60102
Estimated Value: $418,518 - $456,000
4
Beds
--
Bath
2,214
Sq Ft
$199/Sq Ft
Est. Value
About This Home
This home is located at 421 Winding Canyon Way, Algonquin, IL 60102 and is currently estimated at $439,630, approximately $198 per square foot. 421 Winding Canyon Way is a home located in Kane County with nearby schools including Algonquin Lakes Elementary School, Algonquin Middle School, and Dundee-Crown High School.
Ownership History
Date
Name
Owned For
Owner Type
Purchase Details
Closed on
Jul 7, 2017
Sold by
Lin William
Bought by
Ingold David E
Current Estimated Value
Home Financials for this Owner
Home Financials are based on the most recent Mortgage that was taken out on this home.
Original Mortgage
$230,990
Outstanding Balance
$192,019
Interest Rate
3.91%
Mortgage Type
FHA
Estimated Equity
$247,611
Purchase Details
Closed on
Mar 17, 2008
Sold by
Hendrawan Williams and Lin William
Bought by
Lin William
Purchase Details
Closed on
Sep 14, 2001
Sold by
Realen Homes Lp
Bought by
Hendrawan Williams
Home Financials for this Owner
Home Financials are based on the most recent Mortgage that was taken out on this home.
Original Mortgage
$191,600
Interest Rate
6.97%
Create a Home Valuation Report for This Property
The Home Valuation Report is an in-depth analysis detailing your home's value as well as a comparison with similar homes in the area
Home Values in the Area
Average Home Value in this Area
Purchase History
| Date | Buyer | Sale Price | Title Company |
|---|---|---|---|
| Ingold David E | $240,000 | Precision Title | |
| Lin William | -- | None Available | |
| Hendrawan Williams | $240,000 | Chicago Title Insurance Co |
Source: Public Records
Mortgage History
| Date | Status | Borrower | Loan Amount |
|---|---|---|---|
| Open | Ingold David E | $230,990 | |
| Previous Owner | Hendrawan Williams | $191,600 |
Source: Public Records
Tax History Compared to Growth
Tax History
| Year | Tax Paid | Tax Assessment Tax Assessment Total Assessment is a certain percentage of the fair market value that is determined by local assessors to be the total taxable value of land and additions on the property. | Land | Improvement |
|---|---|---|---|---|
| 2024 | $9,009 | $126,492 | $25,730 | $100,762 |
| 2023 | $8,612 | $113,813 | $23,151 | $90,662 |
| 2022 | $8,360 | $106,030 | $23,151 | $82,879 |
| 2021 | $8,115 | $100,113 | $21,859 | $78,254 |
| 2020 | $7,958 | $97,863 | $21,368 | $76,495 |
| 2019 | $7,716 | $92,902 | $20,285 | $72,617 |
| 2018 | $7,711 | $89,628 | $19,883 | $69,745 |
| 2017 | $7,401 | $83,843 | $18,600 | $65,243 |
| 2016 | $7,274 | $78,047 | $18,522 | $59,525 |
| 2015 | -- | $73,133 | $17,356 | $55,777 |
| 2014 | -- | $64,335 | $16,877 | $47,458 |
| 2013 | -- | $66,305 | $17,394 | $48,911 |
Source: Public Records
Map
Nearby Homes
- 400 Diamond Back Way
- 9999 Sandbloom Rd
- 460 Mahogany Dr
- 601 Lake Cornish Way
- 451 Mahogany Dr
- 2003 Magenta Ln
- 1114 Riverwood Dr Unit 1114
- 1535 Teri Ln
- Lot 4 b Ryan Pkwy
- 1770 E Algonquin Rd
- 2150 E Algonquin Rd
- 1943 Ozark Pkwy
- 69 Alice St
- 1551 Glacier Trail Unit 644
- 1659 E Algonquin Rd
- 1782 Cumberland Pkwy
- 2 Cumberland Pkwy
- 1715 Riverwood Dr
- 2260 Indigo Dr
- 1670 Yosemite Pkwy
- 431 Winding Canyon Way
- 1 Winding Canyon Ct
- 3 Winding Canyon Ct
- 441 Winding Canyon Way
- 5 Winding Canyon Ct
- 430 Winding Canyon Way
- 440 Winding Canyon Way
- 314 Lake Gillilan Way Unit 252
- 312 Lake Gillilan Way Unit 253
- 420 Winding Canyon Way
- 451 Winding Canyon Way Unit 3A
- 450 Winding Canyon Way
- 7 Winding Canyon Ct
- 316 Lake Gillilan Way Unit 251
- 2 Winding Canyon Ct
- 301 Lake Gillilan Way Unit 151
- 410 Winding Canyon Way
- 460 Winding Canyon Way
- 4 Winding Canyon Ct
- 350 Lake Gillilan Way Unit 214A