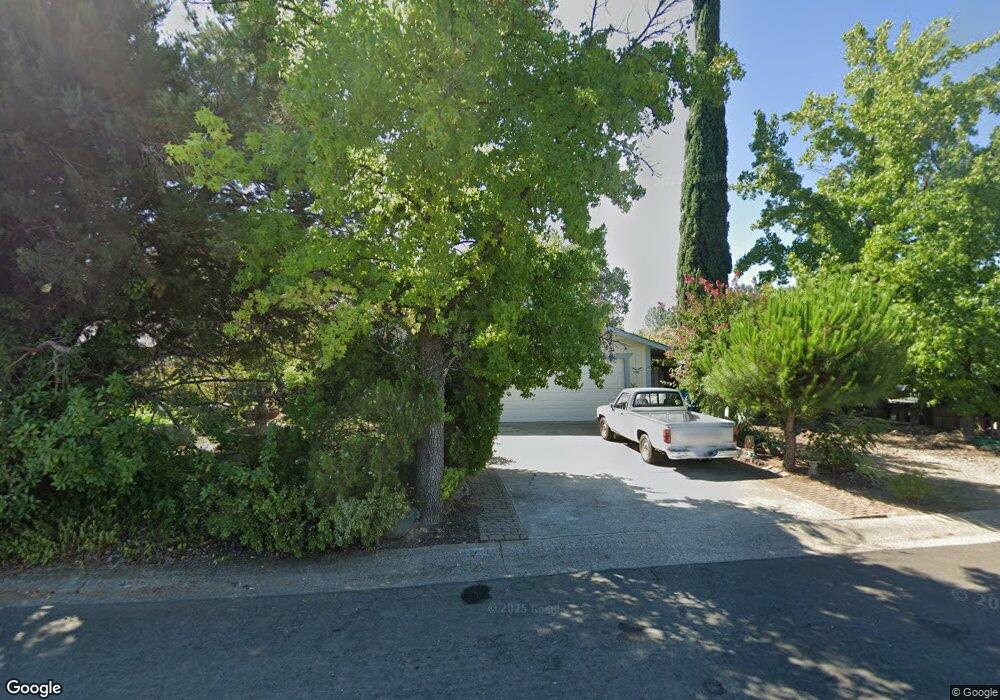
4213 Ormsby Way Redding, CA 96003
Mountain Lakes NeighborhoodEstimated Value: $261,000 - $301,000
2
Beds
2
Baths
1,000
Sq Ft
$278/Sq Ft
Est. Value
About This Home
This home is located at 4213 Ormsby Way, Redding, CA 96003 and is currently estimated at $278,194, approximately $278 per square foot. 4213 Ormsby Way is a home located in Shasta County with nearby schools including Redding STEM Academy.
Ownership History
Date
Name
Owned For
Owner Type
Purchase Details
Closed on
Jun 17, 2009
Sold by
Steele Mary M and Bamford Mary M
Bought by
Steele Mary M
Current Estimated Value
Home Financials for this Owner
Home Financials are based on the most recent Mortgage that was taken out on this home.
Original Mortgage
$127,800
Outstanding Balance
$80,963
Interest Rate
4.82%
Mortgage Type
Stand Alone Refi Refinance Of Original Loan
Estimated Equity
$197,231
Purchase Details
Closed on
Apr 21, 2003
Sold by
Steele Paul A
Bought by
Steele Mary M
Home Financials for this Owner
Home Financials are based on the most recent Mortgage that was taken out on this home.
Original Mortgage
$113,900
Interest Rate
5.54%
Mortgage Type
Purchase Money Mortgage
Purchase Details
Closed on
Aug 12, 1997
Sold by
Kay
Bought by
Bamford Mary M
Home Financials for this Owner
Home Financials are based on the most recent Mortgage that was taken out on this home.
Original Mortgage
$73,413
Interest Rate
7.45%
Mortgage Type
FHA
Create a Home Valuation Report for This Property
The Home Valuation Report is an in-depth analysis detailing your home's value as well as a comparison with similar homes in the area
Home Values in the Area
Average Home Value in this Area
Purchase History
| Date | Buyer | Sale Price | Title Company |
|---|---|---|---|
| Steele Mary M | -- | Placer Title Company | |
| Steele Mary M | -- | First American Title Co | |
| Bamford Mary M | $73,500 | Fidelity National Title Co |
Source: Public Records
Mortgage History
| Date | Status | Borrower | Loan Amount |
|---|---|---|---|
| Open | Steele Mary M | $127,800 | |
| Closed | Steele Mary M | $113,900 | |
| Closed | Bamford Mary M | $73,413 |
Source: Public Records
Tax History
| Year | Tax Paid | Tax Assessment Tax Assessment Total Assessment is a certain percentage of the fair market value that is determined by local assessors to be the total taxable value of land and additions on the property. | Land | Improvement |
|---|---|---|---|---|
| 2025 | $1,620 | $155,594 | $31,921 | $123,673 |
| 2024 | $1,587 | $152,545 | $31,296 | $121,249 |
| 2023 | $1,587 | $149,555 | $30,683 | $118,872 |
| 2022 | $1,544 | $146,624 | $30,082 | $116,542 |
| 2021 | $1,522 | $143,750 | $29,493 | $114,257 |
| 2020 | $1,514 | $142,277 | $29,191 | $113,086 |
| 2019 | $1,466 | $139,488 | $28,619 | $110,869 |
| 2018 | $1,465 | $136,754 | $28,058 | $108,696 |
| 2017 | $1,439 | $134,073 | $27,508 | $106,565 |
| 2016 | $1,375 | $131,445 | $26,969 | $104,476 |
| 2015 | $1,353 | $129,471 | $26,564 | $102,907 |
| 2014 | $1,361 | $126,936 | $26,044 | $100,892 |
Source: Public Records
Map
Nearby Homes
- 1220 Pershing St
- 1077 Eagle Nest Rd
- 1059 Eagle Nest Rd
- 4288 Bradley Dr
- 4300 Caterpillar Rd
- 4521 White River Dr
- 1112 Yogi Ct
- 4576 Hickory Trail
- 836 August Way
- 1220 Mountain Shadows Blvd Unit 263
- 1237 Mountain Shadows Blvd
- 977 Tuberose Trail
- 1318 Mountain Shadows Blvd
- 1025 Mountain Shadows Blvd
- 808 Butternut Trail
- 4098 Saint Patricks Ave
- 4753 White River Dr
- 852 Lake Blvd
- 3588 Magnums Way
- 0 Lake Blvd
- 4189 Ormsby Way
- 4235 Ormsby Way
- 4269 Ormsby Way
- 4155 Ormsby Way
- 1156 Beltline Rd
- 1170 Beltline Rd
- 4291 Ormsby Way
- 4111 Ormsby Way
- 4242 Ormsby Way
- 4170 Ormsby Way
- 1144 Beltline Rd
- 1203 Bradley Dr
- 4095 Ormsby Way
- 1223 Pershing St
- 1132 Beltline Rd
- 1226 Beltline Rd
- 1217 Bradley Dr
- 4073 Ormsby Way
- 1237 Pershing St
- 1234 Pershing St Unit 1
Your Personal Tour Guide
Ask me questions while you tour the home.