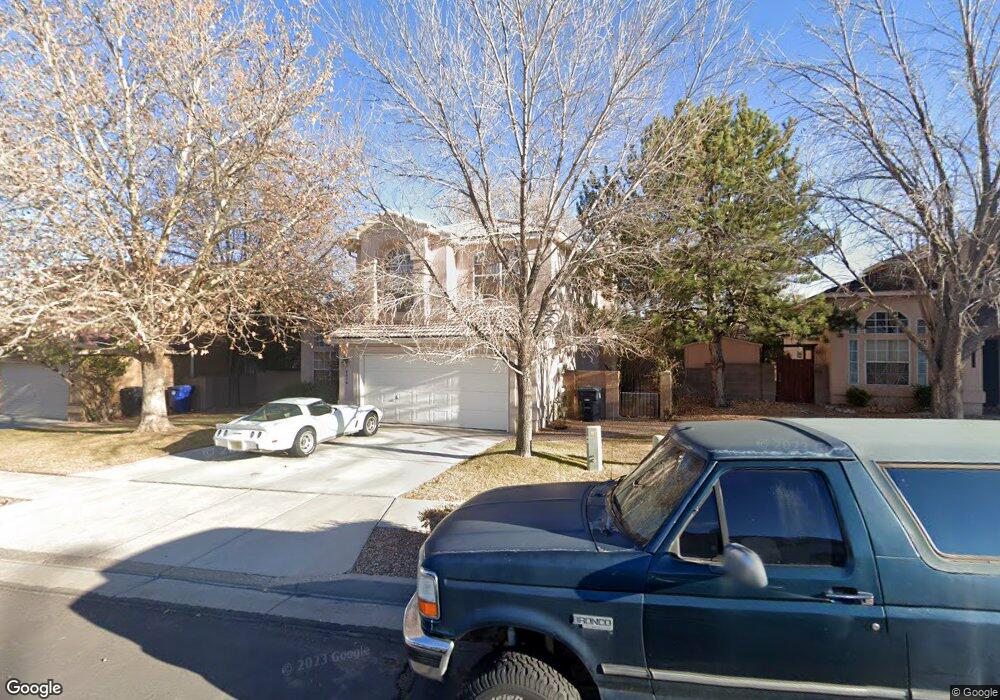
4216 Rancho Grande Place NW Albuquerque, NM 87120
Taylor Ranch NeighborhoodEstimated Value: $375,000 - $383,000
3
Beds
3
Baths
1,830
Sq Ft
$206/Sq Ft
Est. Value
About This Home
This home is located at 4216 Rancho Grande Place NW, Albuquerque, NM 87120 and is currently estimated at $377,830, approximately $206 per square foot. 4216 Rancho Grande Place NW is a home located in Bernalillo County with nearby schools including Chamiza Elementary School, L.B. Johnson Middle School, and Volcano Vista High School.
Create a Home Valuation Report for This Property
The Home Valuation Report is an in-depth analysis detailing your home's value as well as a comparison with similar homes in the area
Home Values in the Area
Average Home Value in this Area
Tax History Compared to Growth
Tax History
| Year | Tax Paid | Tax Assessment Tax Assessment Total Assessment is a certain percentage of the fair market value that is determined by local assessors to be the total taxable value of land and additions on the property. | Land | Improvement |
|---|---|---|---|---|
| 2025 | $2,937 | $71,710 | $14,108 | $57,602 |
| 2024 | $2,937 | $69,622 | $13,698 | $55,924 |
| 2023 | $2,889 | $67,594 | $13,299 | $54,295 |
| 2022 | $2,791 | $65,625 | $12,911 | $52,714 |
| 2021 | $2,698 | $63,714 | $12,535 | $51,179 |
| 2020 | $2,653 | $61,858 | $12,170 | $49,688 |
| 2019 | $1,275 | $60,057 | $11,816 | $48,241 |
| 2018 | $2,484 | $60,057 | $11,816 | $48,241 |
| 2017 | $2,353 | $58,308 | $11,472 | $46,836 |
| 2016 | $2,338 | $54,962 | $10,814 | $44,148 |
| 2015 | $53,361 | $53,361 | $10,499 | $42,862 |
| 2014 | $2,266 | $53,361 | $10,499 | $42,862 |
| 2013 | -- | $53,361 | $10,499 | $42,862 |
Source: Public Records
Map
Nearby Homes
- 7708 Ridgeview Dr NW
- 7434 Riverton Dr NW
- 4309 Rancho Largo Rd NW
- 7739 Ridgeview Dr NW
- 4500 Samara Rd NW
- 7809 Juneberry St NW
- 8100 Rancho Viejo Ct NW
- 7824 Snowberry St NW
- 4320 La Paloma Rd NW
- 4512 Waynesboro Rd NW
- 4612 Lobelia Rd NW
- 3920 Rancho Centro NW
- 4600 Waynesboro Place NW
- 6409 Coors Blvd NW
- 6443 Brenton Dr NW
- 7432 Primrose Dr NW
- 7516 Wells Fargo Trail NW
- 8204 Rancho Paraiso NW
- 4515 Millwood Ct NW
- 4736 Galleta Rd NW
- 4212 Rancho Grande Place NW
- 4220 Rancho Grande Place NW
- 4219 Rancho Bonito Dr NW
- 4215 Rancho Bonito Dr NW
- 4208 Rancho Grande Place NW
- 4223 Rancho Bonito Dr NW
- 4224 Rancho Grande Place NW
- 4209 Rancho Bonito Dr NW
- 4215 Rancho Grande Place NW
- 4219 Rancho Grande Place NW
- 4223 Rancho Grande Place NW
- 4204 Rancho Grande Place NW
- 4209 Rancho Grande Place NW
- 4227 Rancho Grande Place NW
- 4300 Rancho Grande Place NW
- 4227 Rancho Bonito Dr NW
- 4205 Rancho Bonito Dr NW
- 4301 Rancho Bonito Dr NW
- 4200 Rancho Grande Place NW
- 4205 Rancho Grande Place NW