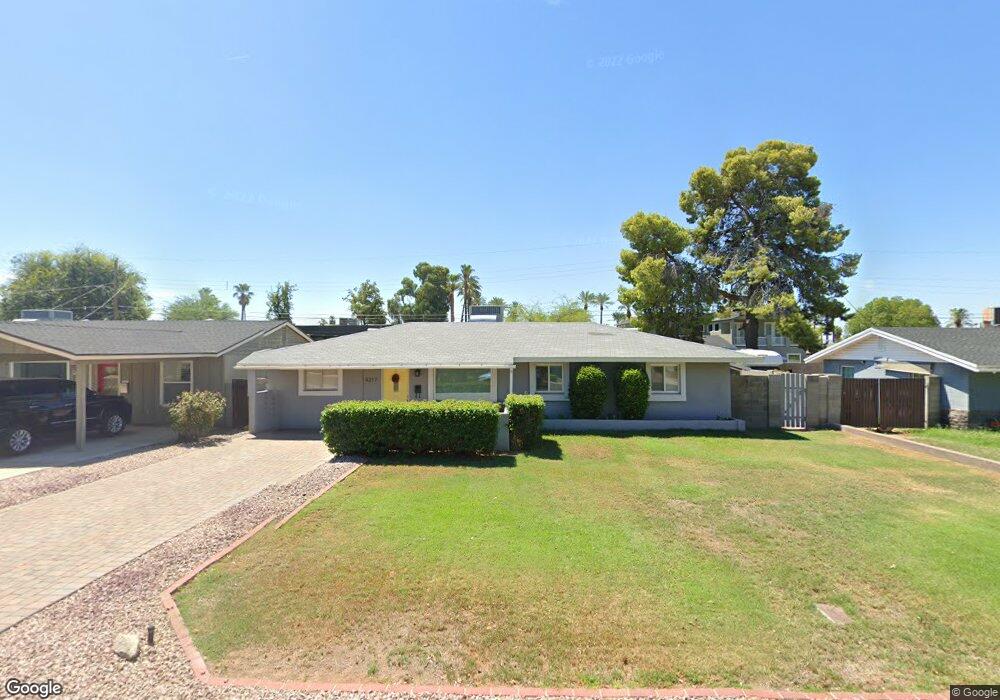
4217 E Sells Dr Phoenix, AZ 85018
Camelback East Village NeighborhoodEstimated Value: $649,719 - $941,000
Studio
2
Baths
1,536
Sq Ft
$538/Sq Ft
Est. Value
About This Home
This home is located at 4217 E Sells Dr, Phoenix, AZ 85018 and is currently estimated at $826,430, approximately $538 per square foot. 4217 E Sells Dr is a home located in Maricopa County with nearby schools including Hopi Elementary School, Ingleside Middle School, and Arcadia High School.
Ownership History
Date
Name
Owned For
Owner Type
Purchase Details
Closed on
Jun 27, 2005
Sold by
Grubb Scott B and Tucker Grubb Patricia A
Bought by
Chrysanthemum Llc
Current Estimated Value
Purchase Details
Closed on
May 5, 1995
Sold by
Miranda Prado and Miranda Martha E
Bought by
Grubb Scott B and Grubb Patricia A
Home Financials for this Owner
Home Financials are based on the most recent Mortgage that was taken out on this home.
Original Mortgage
$67,600
Interest Rate
7.9%
Mortgage Type
FHA
Create a Home Valuation Report for This Property
The Home Valuation Report is an in-depth analysis detailing your home's value as well as a comparison with similar homes in the area
Home Values in the Area
Average Home Value in this Area
Purchase History
| Date | Buyer | Sale Price | Title Company |
|---|---|---|---|
| Chrysanthemum Llc | $330,000 | First American Title Ins Co | |
| Grubb Scott B | $68,000 | Grand Canyon Title Agency In |
Source: Public Records
Mortgage History
| Date | Status | Borrower | Loan Amount |
|---|---|---|---|
| Previous Owner | Grubb Scott B | $67,600 |
Source: Public Records
Tax History
| Year | Tax Paid | Tax Assessment Tax Assessment Total Assessment is a certain percentage of the fair market value that is determined by local assessors to be the total taxable value of land and additions on the property. | Land | Improvement |
|---|---|---|---|---|
| 2025 | $2,604 | $31,647 | -- | -- |
| 2024 | $2,437 | $30,140 | -- | -- |
| 2023 | $2,437 | $50,530 | $10,100 | $40,430 |
| 2022 | $2,338 | $40,280 | $8,050 | $32,230 |
| 2021 | $2,423 | $35,530 | $7,100 | $28,430 |
| 2020 | $2,387 | $35,020 | $7,000 | $28,020 |
| 2019 | $2,298 | $33,150 | $6,630 | $26,520 |
| 2018 | $2,210 | $31,080 | $6,210 | $24,870 |
| 2017 | $2,123 | $28,560 | $5,710 | $22,850 |
| 2016 | $1,750 | $23,770 | $4,750 | $19,020 |
| 2015 | $1,604 | $21,410 | $4,280 | $17,130 |
Source: Public Records
Map
Nearby Homes
- 4312 E Roma Ave
- 4311 E Sells Dr
- 4227 E Campbell Ave
- 4308 E Montecito Ave
- 4419 N 43rd Place
- 4126 E Sells Dr Unit 106
- 4126 E Sells Dr
- 4234 N 42nd Place
- 4120 E Campbell Ave
- 4402 E Montecito Ave
- 4113 E Glenrosa Ave
- 4317 E Glenrosa Ave
- 4203 E Hazelwood St
- 4242 N 44th St
- 4411 N 40th St Unit 55
- 4223 N 41st Place
- 4037 E Minnezona Ave
- 4209 E Patricia Jane Dr
- 4228 N 44th Place
- 4009 E Campbell Ave Unit 16
- 4223 E Sells Dr
- 4211 E Sells Dr
- 4218 E Roma Ave
- 4227 E Sells Dr
- 4207 E Sells Dr
- 4212 E Roma Ave
- 4222 E Roma Ave
- 4218 E Sells Dr
- 4214 E Sells Dr
- 4224 E Sells Dr
- 4208 E Roma Ave
- 4228 E Roma Ave
- 4233 E Sells Dr
- 4208 E Sells Dr
- 4201 E Sells Dr
- 4230 E Sells Dr
- 4202 E Roma Ave
- 4234 E Roma Ave
- 4202 E Sells Dr
- 4237 E Sells Dr
Your Personal Tour Guide
Ask me questions while you tour the home.