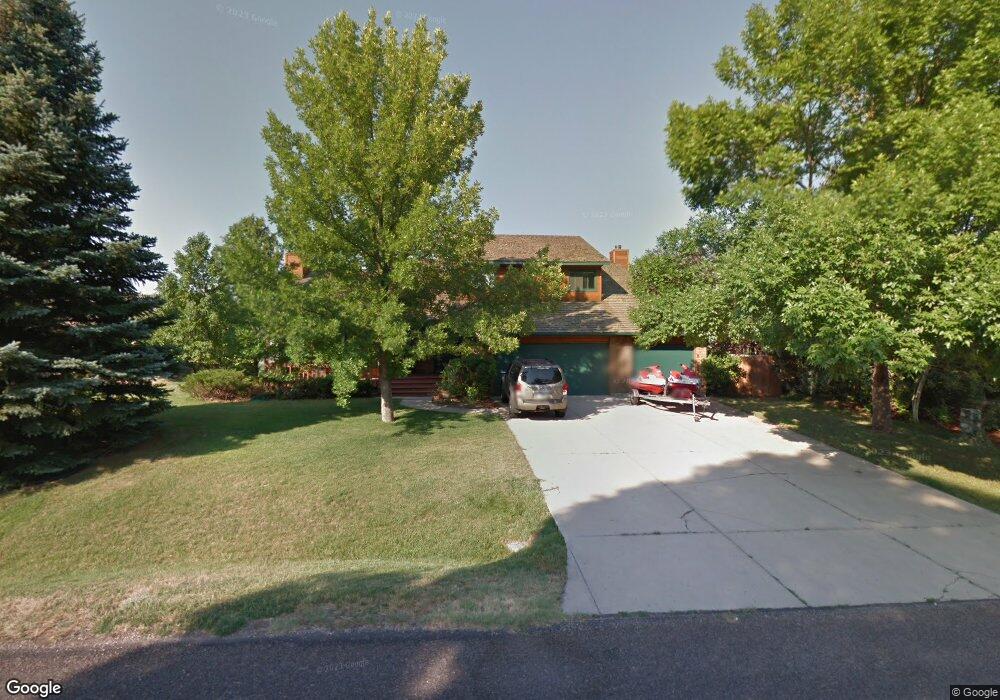
4217 Picadilly Dr Fort Collins, CO 80526
Estimated Value: $818,128 - $906,000
4
Beds
5
Baths
2,412
Sq Ft
$363/Sq Ft
Est. Value
About This Home
This home is located at 4217 Picadilly Dr, Fort Collins, CO 80526 and is currently estimated at $875,282, approximately $362 per square foot. 4217 Picadilly Dr is a home located in Larimer County with nearby schools including McGraw Elementary School, Webber Middle School, and Rocky Mountain High School.
Ownership History
Date
Name
Owned For
Owner Type
Purchase Details
Closed on
May 10, 2010
Sold by
Becker Karen D
Bought by
Becker James K
Current Estimated Value
Purchase Details
Closed on
Sep 18, 2002
Sold by
Huval Steven James and Huval Deborah Renee
Bought by
Becker James K and Becker Karen D
Home Financials for this Owner
Home Financials are based on the most recent Mortgage that was taken out on this home.
Original Mortgage
$300,700
Outstanding Balance
$125,704
Interest Rate
6.25%
Estimated Equity
$749,578
Purchase Details
Closed on
Aug 20, 1998
Sold by
Lake Dale G
Bought by
Huval Steven James and Huval Deborah Renee
Home Financials for this Owner
Home Financials are based on the most recent Mortgage that was taken out on this home.
Original Mortgage
$125,000
Interest Rate
6.75%
Purchase Details
Closed on
Mar 1, 1995
Sold by
Teel Richard E
Bought by
Lake Geraldine S
Create a Home Valuation Report for This Property
The Home Valuation Report is an in-depth analysis detailing your home's value as well as a comparison with similar homes in the area
Home Values in the Area
Average Home Value in this Area
Purchase History
| Date | Buyer | Sale Price | Title Company |
|---|---|---|---|
| Becker James K | -- | None Available | |
| Becker James K | $377,000 | -- | |
| Huval Steven James | $300,000 | -- | |
| Lake Geraldine S | $259,900 | -- |
Source: Public Records
Mortgage History
| Date | Status | Borrower | Loan Amount |
|---|---|---|---|
| Open | Becker James K | $300,700 | |
| Previous Owner | Huval Steven James | $125,000 |
Source: Public Records
Tax History Compared to Growth
Tax History
| Year | Tax Paid | Tax Assessment Tax Assessment Total Assessment is a certain percentage of the fair market value that is determined by local assessors to be the total taxable value of land and additions on the property. | Land | Improvement |
|---|---|---|---|---|
| 2025 | $5,308 | $57,319 | $6,030 | $51,289 |
| 2024 | $5,061 | $57,319 | $6,030 | $51,289 |
| 2022 | $4,180 | $42,895 | $6,255 | $36,640 |
| 2021 | $4,219 | $44,130 | $6,435 | $37,695 |
| 2020 | $4,119 | $42,721 | $6,435 | $36,286 |
| 2019 | $4,136 | $42,721 | $6,435 | $36,286 |
| 2018 | $3,171 | $33,754 | $6,480 | $27,274 |
| 2017 | $3,160 | $33,754 | $6,480 | $27,274 |
| 2016 | $3,075 | $32,684 | $7,164 | $25,520 |
| 2015 | $3,053 | $36,690 | $7,160 | $29,530 |
| 2014 | $2,709 | $28,820 | $5,410 | $23,410 |
Source: Public Records
Map
Nearby Homes
- 2409 Denby Ct
- 2508 Doolittle Ct
- 2213 Grosvenor Ct
- 2300 W County Road 38 E Unit 130
- 2300 W County Road 38 E Unit 16
- 2300 W County Road 38 E Unit 203
- 2300 W County Road 38 E Unit 94
- 1938 Silvergate Rd
- 2846 Wild Rose Way
- 1808 Silvergate Rd
- 3712 Mead St
- 3717 S Taft Hill Rd Unit 279
- 3717 S Taft Hill Rd Unit 111
- 1802 Prairie Ridge Dr
- 1736 Rolling Gate Rd
- 2415 Dalton Dr
- 4609 Dusty Sage Dr Unit 3
- 3525 Auntie Stone St Unit 8
- 4500 Seneca St Unit 71
- 4500 Seneca St Unit 36
- 4213 Picadilly Dr
- 4221 Picadilly Dr
- 2401 Denby Ct
- 4225 Picadilly Dr
- 4209 Picadilly Dr
- 2405 Denby Ct
- 2400 Denby Ct
- 4216 Picadilly Dr
- 4220 Picadilly Dr
- 4305 Picadilly Dr
- 4208 Picadilly Dr
- 2404 Denby Ct
- 4204 Picadilly Dr
- 4213 Trowbridge Dr
- 4220 Wellington Dr
- 2304 Lathrop Ct
- 2300 Lathrop Ct
- 4209 Trowbridge Dr
- 4309 Picadilly Dr
- 4309 Picadilly Dr