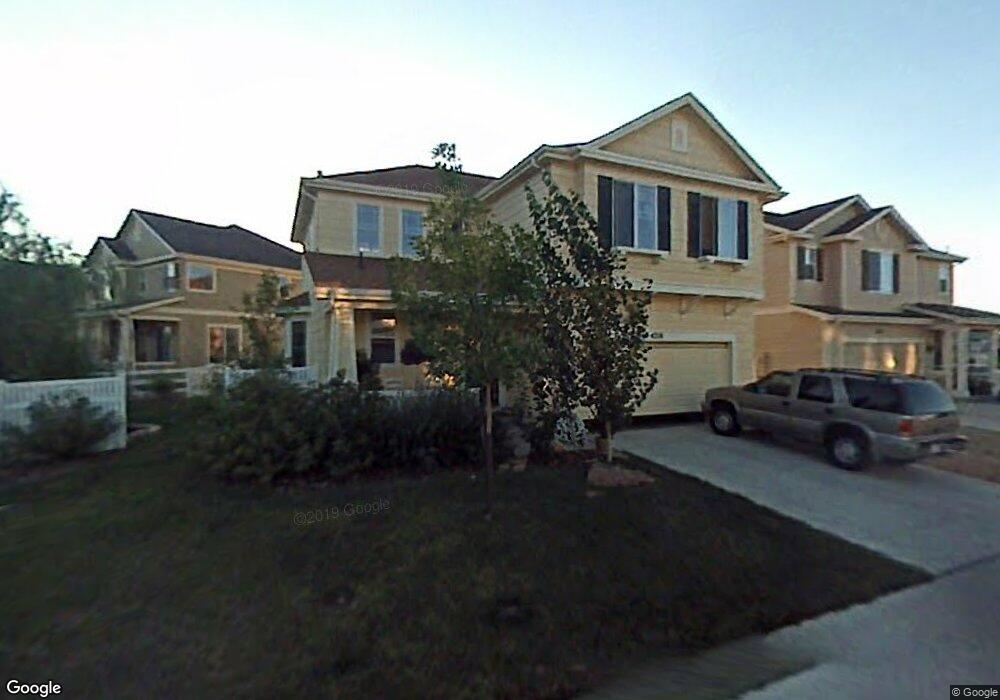
4218 Arezzo Dr Longmont, CO 80503
Upper Clover Basin NeighborhoodEstimated Value: $664,146 - $709,000
3
Beds
3
Baths
1,782
Sq Ft
$385/Sq Ft
Est. Value
About This Home
This home is located at 4218 Arezzo Dr, Longmont, CO 80503 and is currently estimated at $685,537, approximately $384 per square foot. 4218 Arezzo Dr is a home located in Boulder County with nearby schools including Eagle Crest Elementary School, Altona Middle School, and Silver Creek High School.
Ownership History
Date
Name
Owned For
Owner Type
Purchase Details
Closed on
Jun 14, 2019
Sold by
Thomas Charlene Patricia and Rogers Stephen Wilson
Bought by
Zwetsch Richard D and Capriccioso Caryn M
Current Estimated Value
Home Financials for this Owner
Home Financials are based on the most recent Mortgage that was taken out on this home.
Original Mortgage
$412,250
Outstanding Balance
$362,469
Interest Rate
4.1%
Mortgage Type
New Conventional
Estimated Equity
$323,068
Purchase Details
Closed on
Nov 30, 2005
Sold by
Cph Longmont Llc
Bought by
Thomas Charlene Patricia and Rogers Stephen Wilson
Home Financials for this Owner
Home Financials are based on the most recent Mortgage that was taken out on this home.
Original Mortgage
$56,700
Interest Rate
6.06%
Mortgage Type
Stand Alone Second
Create a Home Valuation Report for This Property
The Home Valuation Report is an in-depth analysis detailing your home's value as well as a comparison with similar homes in the area
Home Values in the Area
Average Home Value in this Area
Purchase History
| Date | Buyer | Sale Price | Title Company |
|---|---|---|---|
| Zwetsch Richard D | $485,000 | Land Title Guarantee | |
| Thomas Charlene Patricia | $283,739 | Land Title Guarantee Company |
Source: Public Records
Mortgage History
| Date | Status | Borrower | Loan Amount |
|---|---|---|---|
| Open | Zwetsch Richard D | $412,250 | |
| Previous Owner | Thomas Charlene Patricia | $56,700 |
Source: Public Records
Tax History Compared to Growth
Tax History
| Year | Tax Paid | Tax Assessment Tax Assessment Total Assessment is a certain percentage of the fair market value that is determined by local assessors to be the total taxable value of land and additions on the property. | Land | Improvement |
|---|---|---|---|---|
| 2025 | $4,099 | $44,313 | $9,538 | $34,775 |
| 2024 | $4,099 | $44,313 | $9,538 | $34,775 |
| 2023 | $4,043 | $42,847 | $10,137 | $36,394 |
| 2022 | $3,470 | $35,070 | $7,673 | $27,397 |
| 2021 | $3,515 | $36,079 | $7,894 | $28,185 |
| 2020 | $3,319 | $34,170 | $7,079 | $27,091 |
| 2019 | $3,267 | $34,170 | $7,079 | $27,091 |
| 2018 | $2,682 | $28,238 | $6,264 | $21,974 |
| 2017 | $2,646 | $31,219 | $6,925 | $24,294 |
| 2016 | $2,594 | $27,136 | $8,358 | $18,778 |
| 2015 | $2,472 | $22,431 | $5,094 | $17,337 |
| 2014 | $2,095 | $22,431 | $5,094 | $17,337 |
Source: Public Records
Map
Nearby Homes
- 4240 Riley Dr
- 1601 Venice Ln
- 4522 Portofino Dr
- 1663 Venice Ln
- 1580 Venice Ln
- 4532 Heatherhill Ct
- 8584 Summerlin Place
- 1923 High Plains Dr
- 1906 Wildrose Dr
- 5120 Heatherhill St
- 1822 Redtop Ct
- 3617 Sunflower Cir
- 5025 Eagan Cir
- 1901 Fountain Ct
- 906 Cranberry Ct
- 913 Ninebark Ln
- 2286 Star Hill St
- 2316 Star Hill St
- 1004 Chokecherry Ln
- 841 Robert St
- 4214 Arezzo Dr
- 4300 Arezzo Dr
- 4304 Arezzo Dr
- 4206 Arezzo Dr
- 4219 Arezzo Dr
- 4209 Arezzo Dr
- 4210 Arezzo Dr
- 4308 Arezzo Dr
- 4205 Arezzo Dr
- 4312 Arezzo Dr
- 4201 Arezzo Dr
- 4216 Ravenna Place
- 4239 San Marco Dr
- 4220 Ravenna Place
- 4138 Arezzo Dr
- 4212 Ravenna Place
- 4215 San Marco Dr
- 4134 Arezzo Dr
- 4130 Arezzo Dr
- 4208 Ravenna Place