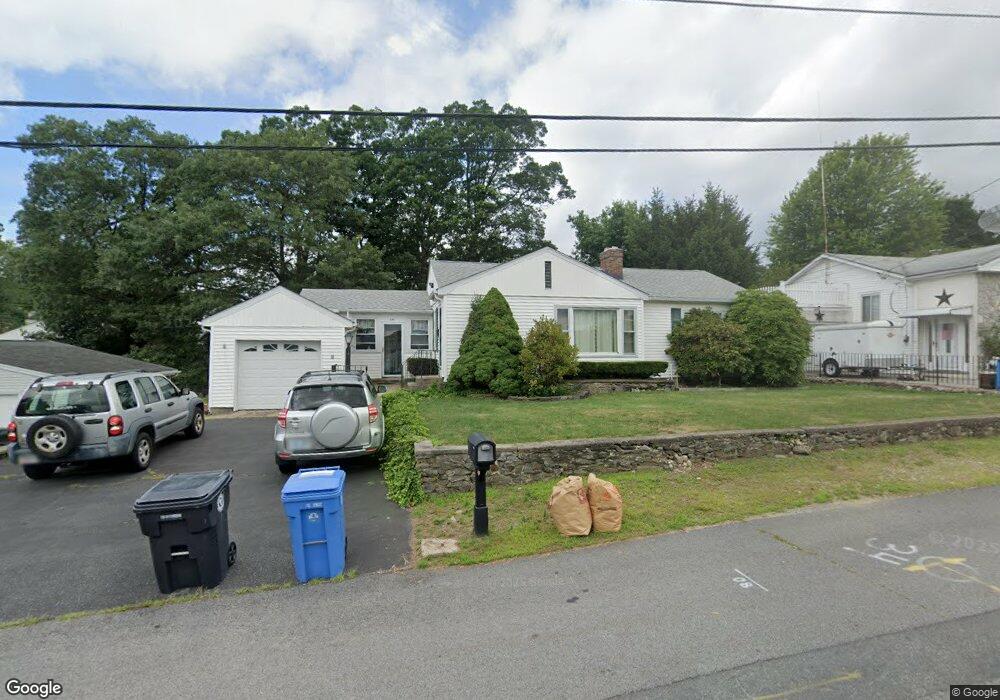
422 England St Cumberland, RI 02864
Valley Falls NeighborhoodEstimated Value: $426,993 - $456,000
2
Beds
2
Baths
1,364
Sq Ft
$323/Sq Ft
Est. Value
About This Home
This home is located at 422 England St, Cumberland, RI 02864 and is currently estimated at $440,748, approximately $323 per square foot. 422 England St is a home located in Providence County with nearby schools including Garvin Memorial School, Joseph L. McCourt Middle School, and Cumberland High School.
Ownership History
Date
Name
Owned For
Owner Type
Purchase Details
Closed on
Oct 6, 2011
Sold by
Culberson Gary F and Culbertson Gina M
Bought by
Culbertson Gary F
Current Estimated Value
Purchase Details
Closed on
Sep 10, 1999
Sold by
D H Psilopoulos Llc
Bought by
Johnston Corp
Purchase Details
Closed on
May 8, 1990
Sold by
Ballou Geoffrey A
Bought by
Vallante Andrew A
Home Financials for this Owner
Home Financials are based on the most recent Mortgage that was taken out on this home.
Original Mortgage
$113,400
Interest Rate
10.18%
Mortgage Type
Purchase Money Mortgage
Create a Home Valuation Report for This Property
The Home Valuation Report is an in-depth analysis detailing your home's value as well as a comparison with similar homes in the area
Home Values in the Area
Average Home Value in this Area
Purchase History
| Date | Buyer | Sale Price | Title Company |
|---|---|---|---|
| Culbertson Gary F | -- | -- | |
| Johnston Corp | $60,000 | -- | |
| Vallante Andrew A | $126,000 | -- |
Source: Public Records
Mortgage History
| Date | Status | Borrower | Loan Amount |
|---|---|---|---|
| Previous Owner | Vallante Andrew A | $164,000 | |
| Previous Owner | Vallante Andrew A | $104,500 | |
| Previous Owner | Vallante Andrew A | $113,400 |
Source: Public Records
Tax History Compared to Growth
Tax History
| Year | Tax Paid | Tax Assessment Tax Assessment Total Assessment is a certain percentage of the fair market value that is determined by local assessors to be the total taxable value of land and additions on the property. | Land | Improvement |
|---|---|---|---|---|
| 2025 | $4,129 | $336,500 | $135,900 | $200,600 |
| 2024 | $4,021 | $336,500 | $135,900 | $200,600 |
| 2023 | $3,910 | $336,500 | $135,900 | $200,600 |
| 2022 | $3,774 | $251,800 | $95,000 | $156,800 |
| 2021 | $3,712 | $251,800 | $95,000 | $156,800 |
| 2020 | $3,606 | $251,800 | $95,000 | $156,800 |
| 2019 | $3,400 | $214,100 | $79,300 | $134,800 |
| 2018 | $3,301 | $214,100 | $79,300 | $134,800 |
| 2017 | $3,256 | $214,100 | $79,300 | $134,800 |
| 2016 | $2,885 | $168,900 | $71,300 | $97,600 |
| 2015 | $2,885 | $168,900 | $71,300 | $97,600 |
| 2014 | $6,375 | $168,900 | $71,300 | $97,600 |
| 2013 | $3,000 | $190,100 | $75,000 | $115,100 |
Source: Public Records
Map
Nearby Homes